


I. Introduction
Metal failure or fatigue usually begins at the surface. Several prominent non-destructive testing (NDT) techniques can be used to detect surface cracks in metal. These techniques include dye penetrant testing, ultrasonic testing, eddy current testing, acoustic emission testing, and radiographic testing [1–3]. In addition, several studies have shown that the detection and sizing of surface cracks in metals can be achieved non-destructively using microwave and mm-wave frequencies [4–9]. Microwave techniques have certain advantages when detecting hairline stress or fatigue cracks. An open-ended waveguide operating at 20 GHz was used as a sensor to detect smaller surface cracks, such as fatigue cracks, through changes in the reflection coefficient [4]. This method, however, can be affected easily by noise, air gaps, and other factors [5]. Several critical parameters of the open-ended waveguide technique were investigated to resolve this problem [6, 7]. The open-ended waveguide technique needs to be used at higher frequencies to achieve high spatial resolution [8]. Open-ended coaxial probes and near-field sensors using resonant probes have been used for crack detection in metallic materials [9, 10]. The resonant probes provide many advantages over other probes based on measurements of the changes in the reflection coefficient. Recently, several techniques with resonant probes have been reported on, including those using a microstrip linear resonator, quarter-wavelength microstrip line, dual-behavior resonator filter, and complementary split-ring resonator [11–14]. A more general review of state-of-the-art NDT techniques using microwave technologies has been provided elsewhere [15]. In these techniques, the metal surface is scanned by a waveguide probe, while its reflection characteristics are monitored using a slotted guide and a diode detector, or with a network analyzer. The crack detection and sizing in these techniques are done by analyzing the overall reflection coefficient of the incident field at different crack positions beneath the waveguide probe aperture. On the other hand, cutoff-cavity probes have been proposed for crack detection in metallic materials [16]. The crack detection in this technique is done by analyzing the resonant current deviation of the cutoff-cavity probe at different crack positions beneath the cutoff-cavity probe aperture. This method is called the forced-resonance microwave method (FRMM). The FRMM uses the current deviation from the resonance state for the cutoff-cavity probe without a crack and with a crack. Therefore, knowledge of the current characteristics of the cutoff-cavity probe is needed to obtain crack signals [17].
This paper presents a method of remote crack detection using a cutoff-cavity probe with a FRMM. This study used a cutoff cavity-backed narrow slot probe based on previous work with the FRMM for crack detection in metal materials [16]. In [16], cavity-backed wide slot apertures were used, and the aperture field distribution was expanded in cavity mode. In this paper, however, cavity-backed narrow slots were used, and the slot could be treated as a thin-wire approximation. The advantage of using the cavity-backed narrow slot aperture instead of the wide slot aperture is the increased crack location detection accuracy. In addition, the thin-wire approximation also has the advantage of being able to easily compute the magnetic current distributions on the crack and narrow slot in the cutoff-cavity probe. This approximation is valid for microwave frequencies on a thin crack and cavity-backed narrow slot. Galerkin’s method of moments was used to obtain the forced-resonance state from which the crack signal was calculated. The cutoff-cavity probe produces forced resonance by adjusting a control element. Forced resonance can be divided into two types: series resonance (SR) and parallel resonance (PR) [16, 17]. SR gives rise to a maximum current, while PR shows sluggish gradient currents. The minimum current occurs at the non-resonance (NR) state via the control element. The FRMM mainly uses SR, but PR and NR can also be used for crack detection. However, PR and NR are not as advantageous as SR [17]. This study examined non-contact crack detection signals using forced-resonance at SR. This method can be used to detect hairline and wide cracks with a single microwave frequency. The cutoff-cavity probe was designed and tested numerically and experimentally, and the crack characteristic signals were detected using the fabricated prototype cutoff-cavity probe.
II. System Description
Fig. 1 shows the geometry of the system of remote crack detection by cutoff-cavity probes using the FRMM. Fig. 1(a) and (b) correspond to reference setting on a non-cracked metal (corresponding to the shorting plate) and the remote (lift-off or non-contact) crack detection, respectively. The detection system consists of four parts: (1) the cutoff cavity-backed narrow slot probe (called a cutoff-cavity probe) and two internal posts, (2) the external control element for cavity resonance control, (3) the generator, and (4) the detector for reading the forced-resonance characteristics and crack characteristic signals. An ammeter or voltmeter can be used as the detector. In this study, an ammeter was chosen.
The cutoff-cavity probe has a narrow slot with a width of Ws and length of Ls and is in a small conducting flange with z = 0. This is backed by a conducting rectangular cutoff cavity of depth c. A crack with width W, length L, and depth d is located in the metal. The cutoff-cavity dimensions were chosen such that a cross-section of cavity a × b corresponds to the cutoff condition for a waveguide of the same cross-section when the cavity is empty. For this reason, it is called the cutoff cavity. In the cutoff cavity, a feed post (#1) with a radius of r1 is located at x = a/2 and z = s1.
The external control element jX1 (acting as a reactance element) is connected to the top of the feed post to obtain the desired forced resonance in the cutoff-cavity probe. For example, commercial products such as coaxial sliding shorts (Model 1909C2 at 0.8–4 GHz; Maury Microwave Corp., Ontario, CA, USA) may be used as the control element. Alternatively, it can be constructed using semi-rigid coaxial cables with SMA connectors. Adjusting the length of the control element changes the reactance value, which changes the characteristics of the cutoff-cavity probe.
An ammeter is connected to the bottom of a parasitic post (#2) with a radius of r2 at y = 0, x = a/2, and z = s2. The ammeter obtains the desired forced resonance and measures the output crack signals. A voltage of V1 is applied at y = 0, x = a/2, and z = s1, and the control element jX1 is connected at y = b, x = a/2, and z = s1. Each parameter referenced in Fig. 1 is listed in Table 1.
Two steps (preparation and detection stages) are necessary to detect surface crack signals in the air gap layer-covered metals using the FRMM.
III. Theoretical Analysis of the FRMM
1. Step 1: Preparation Stage (Reference Setting)
The procedure for using the FRMM and the cutoff-cavity probe to detect surface cracks has been detailed elsewhere [16]. While reference setting, the cutoff-cavity probe and metal are in perfect contact. According to this procedure, the cutoff-cavity probe with a metal shorting plate (in the absence of a crack) uses the control element, jX1, which is connected to the top of feed post #1, to resonate forcefully in the cutoff cavity.
For the cutoff-cavity probe with a shorting plate, as shown in Fig. 1(a), integral equations for current distributions can be derived if the cutoff-cavity probe is fed by a delta gap generator as the voltage source in Step 1. The simultaneous integral equations for the unknown electric currents, J̄1 and J̄2, on feed post #1 and parasitic post #2 in Step 1 are as follows:
where kernels
K ¯ ¯ e e i j I
2. Step 2: Crack Detection Stage
According to the aforementioned procedure, the next step is the detection of crack signals. Fig. 2 depicts the cutoff-cavity probe being scanned toward a crack to detect the crack in the metal material. Fig. 2(a) and (b) demonstrate reference setting (in the preparation stage and in the absence of a crack) and remote crack detection (lift-off or non-contact detection), respectively. The cutoff-cavity probe detects a characteristic crack signal when there is a crack inside the narrow slot of the cutoff cavity. T is the scanning position measured from the crack center to the center of the cavity’s narrow slot.
Fig. 1(b) shows the geometry of a crack and a cutoff-cavity probe when the crack length L is parallel to the broad dimensions of the cavity slot. The cutoff-cavity probe can scan the surface to detect cracks in the metal, and the ammeter records the detector output current on parasitic post #2. If a crack is outside the narrow slot of the cutoff cavity, the detector output current reading will be the same as the detector output current in the short-circuit case of Step 1 (when there is no crack). In this case, the resonant current would be the same as the value detected in the case of a short circuit. On the other hand, if the cutoff cavity had a crack inside the narrow slot, then the detector output current would be different from the short-circuit case in Step 1, and the characteristic crack signal would be detected as a result.
The integral equations are derived by dividing the cutoff-cavity probe with the air gap layer (corresponding to the dielectric layer) covered crack into three regions: a cavity probe (region I), an air gap layer (region II), and a crack (region III), as shown in Fig. 1(b). The simultaneous integral equations for the unknown electric currents on the feed and parasitic post inside the cavity and the unknown magnetic currents M̄1(= ẑ × Ēa1) on the cavity slot aperture and M̄2(= ẑ × Ēa2) on the crack aperture, where Ēa1 and Ēa2 are the aperture electric field in the cavity slot aperture and crack aperture, respectively, can be written as follows:
(2c)
where superscripts I and II denote regions I and II, and subscripts 1, 2, a1 (corresponding to probe aperture, p), and a2 (corresponding to crack aperture, c) represent the feed post #1, parasitic post #2, the cavity probe slot aperture, and the crack aperture, respectively. In addition, ẑ is the unit vector of the z-direction.
d S a 1 ′ d S a 2 ′
where
I ¯ ¯ G ¯ ¯ e i j I G ¯ ¯ e i p I G ¯ ¯ m i j I , II G ¯ ¯ m c c III
The air gap layer (region II) is represented by a parallel-plate waveguide. The Green’s function for region II can be expressed as follows by using the principle of images:
where the distance
R n i j ±
where xi and zi are the coordinates of the field points,
x j ′ z j ′
To solve the simultaneous integral equations with the method of moments for the unknowns, J̄1, J̄2, Ēa1, and Ēa2 were expanded as follows:
where a1k, a2l, e1p, and e2q are the complex expansion coefficients.
Once the current distributions on the internal posts and the slot aperture electric distribution on the crack are given, the crack characteristic signals (deviation of the current on the ammeter) of a crack in a metal can be evaluated.
IV. Theoretical Results
1. Step 1: Preparation Stage
The first step was to find the maximum current (SR) on the ammeter by adjusting the control element, jX1, when the cutoff-cavity probe was on metal with no crack. The cutoff-cavity probe of the metal was analyzed. The analysis results showed that the cutoff-cavity probe could be resonated forcefully by the control element in both SR and PR. This study focused on using SR and the ammeter as a detector.
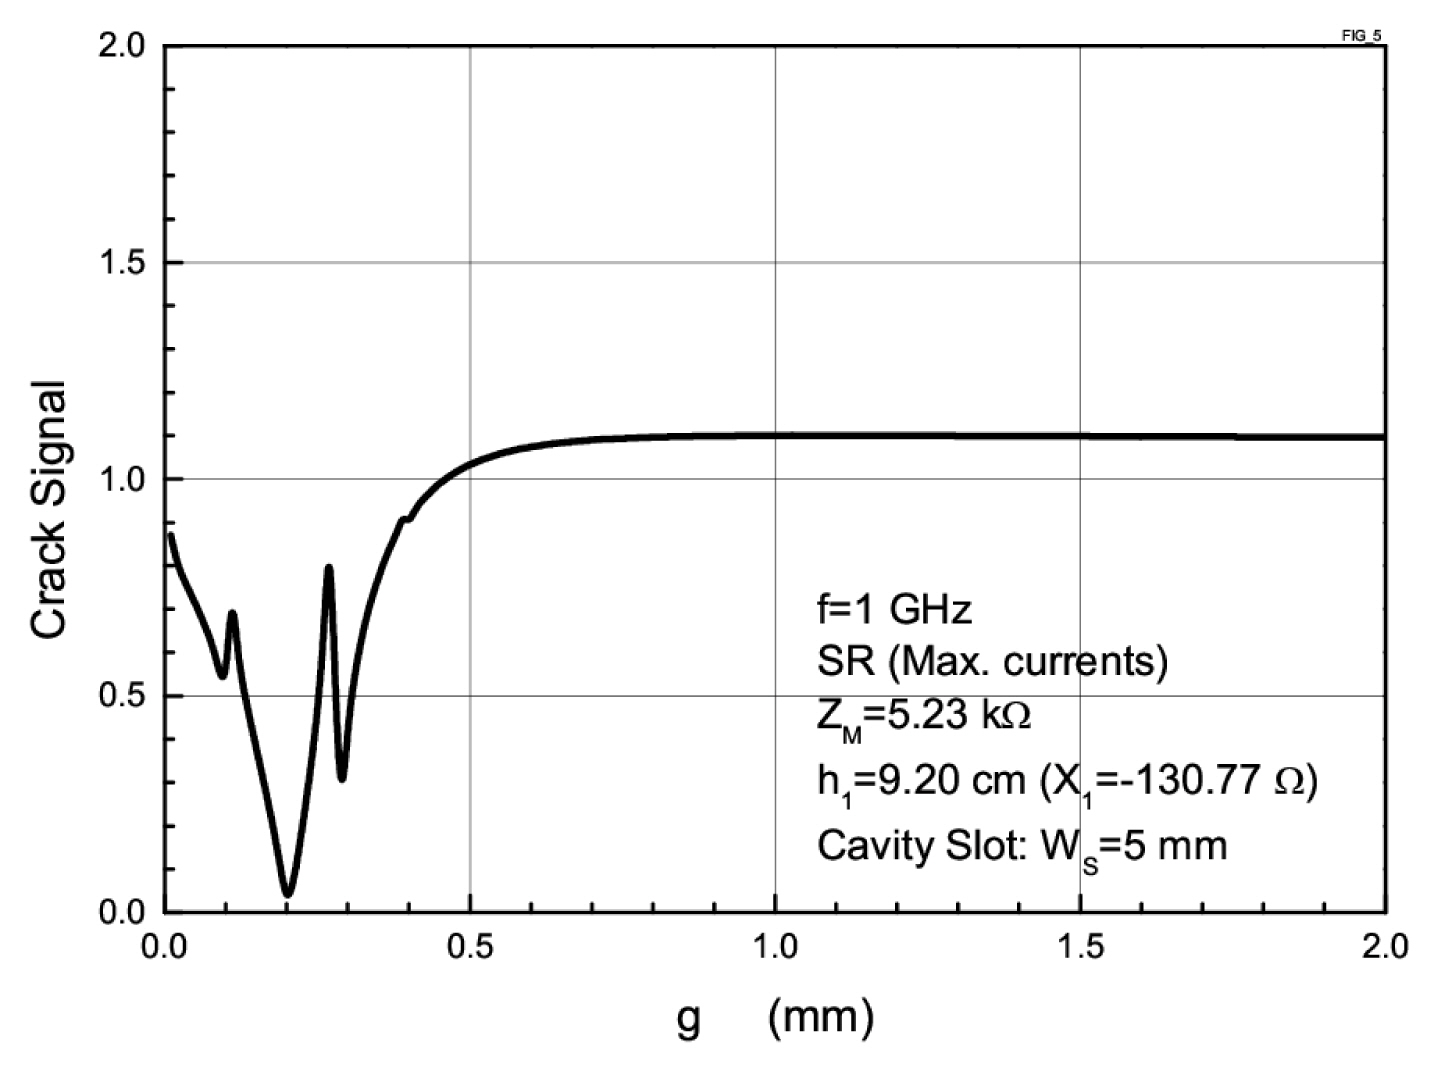
The dimensions of the cutoff-cavity probe used in the numerical calculation were a = 40 mm, b = 20 mm, c = 80 mm, s1 = 30 mm, s2 = 60 mm, and r1 = r2 = 1 mm. The cutoff frequency was 3.75 GHz for the dimension a = 40 mm. The operating frequency was set to 1 GHz, which satisfied the cutoff state. The impedance of the ammeter with a diode was ZM = 5.23 kΩ [5 kΩ (ammeter) + 230 Ω (diode)]. The crack signals were detected by high-frequency diodes (1SS99; NEC Electronics America Inc., Santa Clara, CA, USA) connected to parasitic post #2.
Fig. 3 presents the operating frequency of the cutoff-cavity probe as it correlates with the length of the control element. Forced-resonance occurred when the control element length is adjusted to certain values, generating SR or PR [17]. Fig. 3(a) and (b) show the control element length and reactance versus frequency, respectively.\ At 1 GHz, SR and PR occurred at kh1 = 1.936 (X1 = −130.77 Ω) and kh1 = 0.971 (X1 = 73.18 Ω ), respectively. At 2 GHz, SR and PR occurred at kh1 = 1.411 (X1 = 310.71 Ω) and kh1 = 2.134 (X1 = −79.17 Ω ), respectively. As shown in Fig. 3, for crack detection using the FRMM principle, the operating frequencies are available below the cutoff frequency of 3.75 GHz.
Fig. 4 shows the detector current (referred to as the resonance current or ammeter reading current) and the input impedance of the cutoff-cavity probe versus the length of the control element at 1 GHz [17]. The cutoff-cavity probe with a shorting plate forcefully resonated at SR when kh1=1.936 (X1=−130.77 Ω) for 1 GHz. As shown in Fig. 4, a variation of the input impedance of the cutoff-cavity probe at kh1=1.936 showed a change in behavior from capacitive to inductive, which represents the SR state. Moreover, a variation of the input impedance of the cutoff-cavity probe at kh1=0.971 for 1 GHz showed a change from inductive to capacitive, which represents the PR state. Although it appears that the current at kh1 = 1.317 (X1 = 192.76 Ω) for 1 GHz is minimized (≈0 mA and the non-resonance [NR] state), this study focused only on SR, or the maximum current.
To summarize Step 1, the preparation stage, 1 GHz was selected as the operating frequency, and the SR stage was adopted as the reference current (maximum current). Therefore, the length of the control element was adjusted to obtain the maximum current and the control element, kh1 = 1.936 (X1 = −130.77 Ω), was fixed. The resonance currents were recorded as I2L = 49.97 mA (ammeter reading), which represents the reference current or forced-resonance signal.
Fig. 5 presents the reference signals at the standoff distance from the non-crack material. There was a very rapid change in the reference signal within 0.5 mm. A constant reference signal appeared above a 3 mm standoff distance. In this paper, 1 mm was chosen as the reference value of the standoff distance.
2. Step 2: Crack Detection Stage
When the cutoff-cavity probe moves over a crack on a metal sturface (lift-off of 1 mm), as shown in Fig. 2, its reference current or forced-resonance signal (maximum current) changes. The reactance value of the control element as a reactance element, X1 = −130.77Ω (kh1 = 1.936), for 1 GHz, obtained in Step 1, was entered into (3) to determine the change in current detected on the ammeter when there is a crack. The current expansion modes K = L = 29 and crack aperture electric field expansion mode Q = 19 were used to calculate the convergence results.
As shown in Fig. 2, the scanning position T indicates the position of the cutoff-cavity probe relative to a crack position. The crack signal refers to the variations in the detector current, as a function of scanning position T, which is obtained when the cutoff -cavity probe detects a surface crack in the metal. The difference in the ammeter currents (resonance currents) in Steps 1 and 2 is referred to as the characteristic crack signal.
Fig. 6 shows the crack characteristic signals (normalized crack signals, with respect to the value of the forced-resonance signal in Step 1) recorded at 1 GHz for various crack widths. The crack length L is in the x-direction, classifying it as an x-directed crack. The cutoff-cavity probe was scanned linearly along the y-axis in search of an x-directed crack. As shown in Fig. 6, the detector value did not change significantly when the x-directed crack was outside the narrow slot of the cutoff cavity; the absence of a crack results in a fairly constant signal. As expected, for a y-directed crack (where the crack length is in the y-direction), the detector value did not change while the crack was inside the narrow slot of the cutoff cavity. A crack inside the narrow slot did not prompt a change in the resonance current because there were no-propagation modes.
Fig. 6(a) shows the crack characteristic signals for crack widths when the crack is located in the x-direction using non-contact (standoff or remote) detection. The detector output signals were dependent on the crack widths. In addition, Fig. 6(a) also shows that when the crack length extends beyond the cavity-slot, L > LS (= 40 mm), there will be a considerable perturbation in the crack signal. Fig. 6(b) shows the crack characteristic signals for very thin crack widths when the crack is located in the x-direction using non-contact (standoff or remote) detection. The crack signals were dependent on very thin crack widths. The crack widths were small compared to the wavelength, 3.3 × 10⁻⁵λ (for 1 μm) to 3.3 × 10⁻²λ (for 1 mm), when the operating frequency was 1 GHz. The results showed that the crack signals for wide and narrow cracks were detected at a single operating frequency.
Fig. 7 shows the crack characteristic signals for various wide crack widths, W > WS (= 5 mm), when the crack was located in the x-direction using non-contact detection. The crack signals were also detected and changed for the wide crack width.
Fig. 8 shows the crack characteristic signals for various crack depths when the crack was located in the x-direction using non-contact detection. The cutoff-cavity probe was scanned linearly along the y-axis in search of an x-directed crack. The detector output signals were dependent on the various crack depths. When the operating frequency was 1 GHz, the crack depths were smaller than the wave length, 0.033λ (for 1 mm) to 0.167λ (for 5 mm). The results showed that crack signals for deep and shallow cracks were detected at a single operating frequency. Overall, the operating frequency used in conventional microwave methods for crack detection depends on the dimensions of the crack, but the FRMM can be used to detect cracks with different sizes using a single frequency.
A rapid change in the amplitude of the resonance current occurred when the crack moved within the narrow slot of the cutoff cavity. The amplitude of the resonance current remained fairly constant when the crack was outside the cutoff-cavity probe, as shown in Figs. 6 and 7.
Fig. 9 shows the crack signals at the standoff distance (air gap) from the crack center. There was a very rapid change in the crack signal within 0.5 mm. A constant crack signal appeared above a 0.7 mm standoff distance. Therefore, remote crack detection can be used within 0.7 mm.
V. Experiments
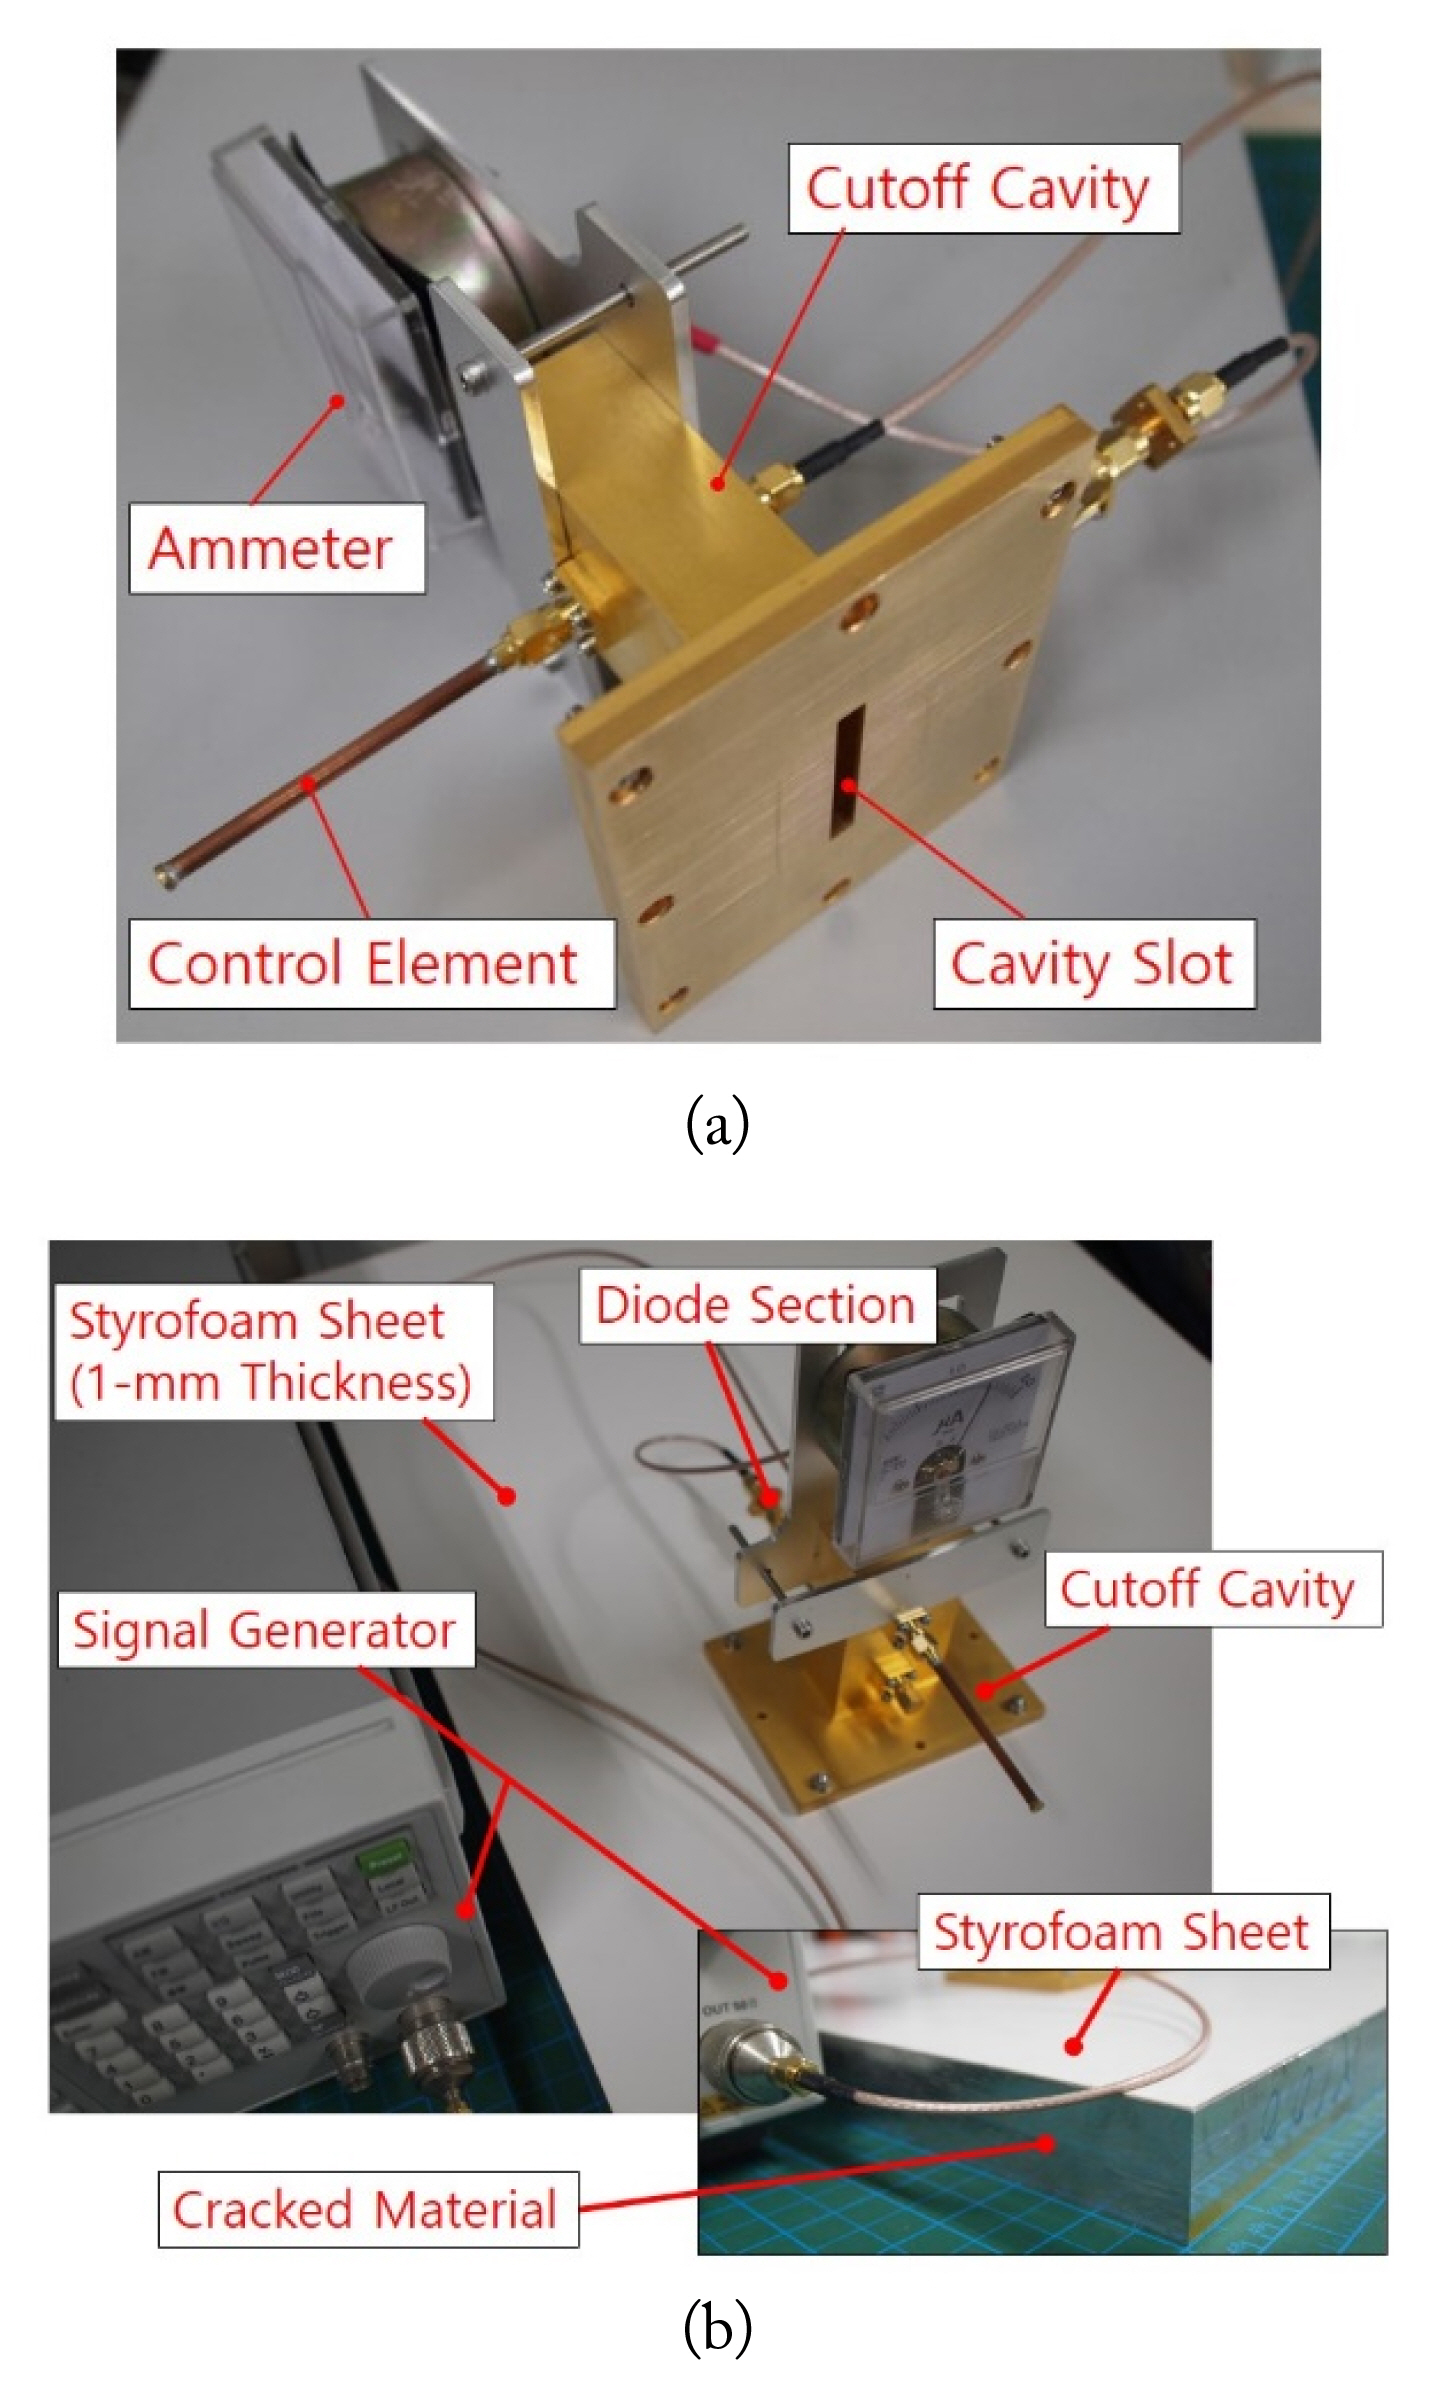
Fig. 10 presents a photograph of the experimental setup. The cutoff cavity-backed narrow slot probe was made with copper and plated with gold. The control reactance element was constructed using a semi-rigid coaxial cable with a short end. The dimensions of the cutoff-cavity probe used in the experiments were a = 40 mm, b = 20 mm, c = 80 mm, s1 = 30 mm, s2 = 60 mm, and r1 = r2 = 1 mm. A 1SS99 (NEC) diode with an ammeter (20 μA range) was connected to the parasitic post. The operating frequency was 1 GHz, and the control element was made of a semi-rigid coaxial cable. The length of the control element was adjusted to obtain the forced resonance in the cutoff-cavity probe with a shorting plate. The cracked material used in the experiment was a thick aluminum plate with a thickness of 50 mm. The dimensions of the crack made on the thick aluminum plate were L = 40 mm, W = 1 mm, and d = 2 mm.
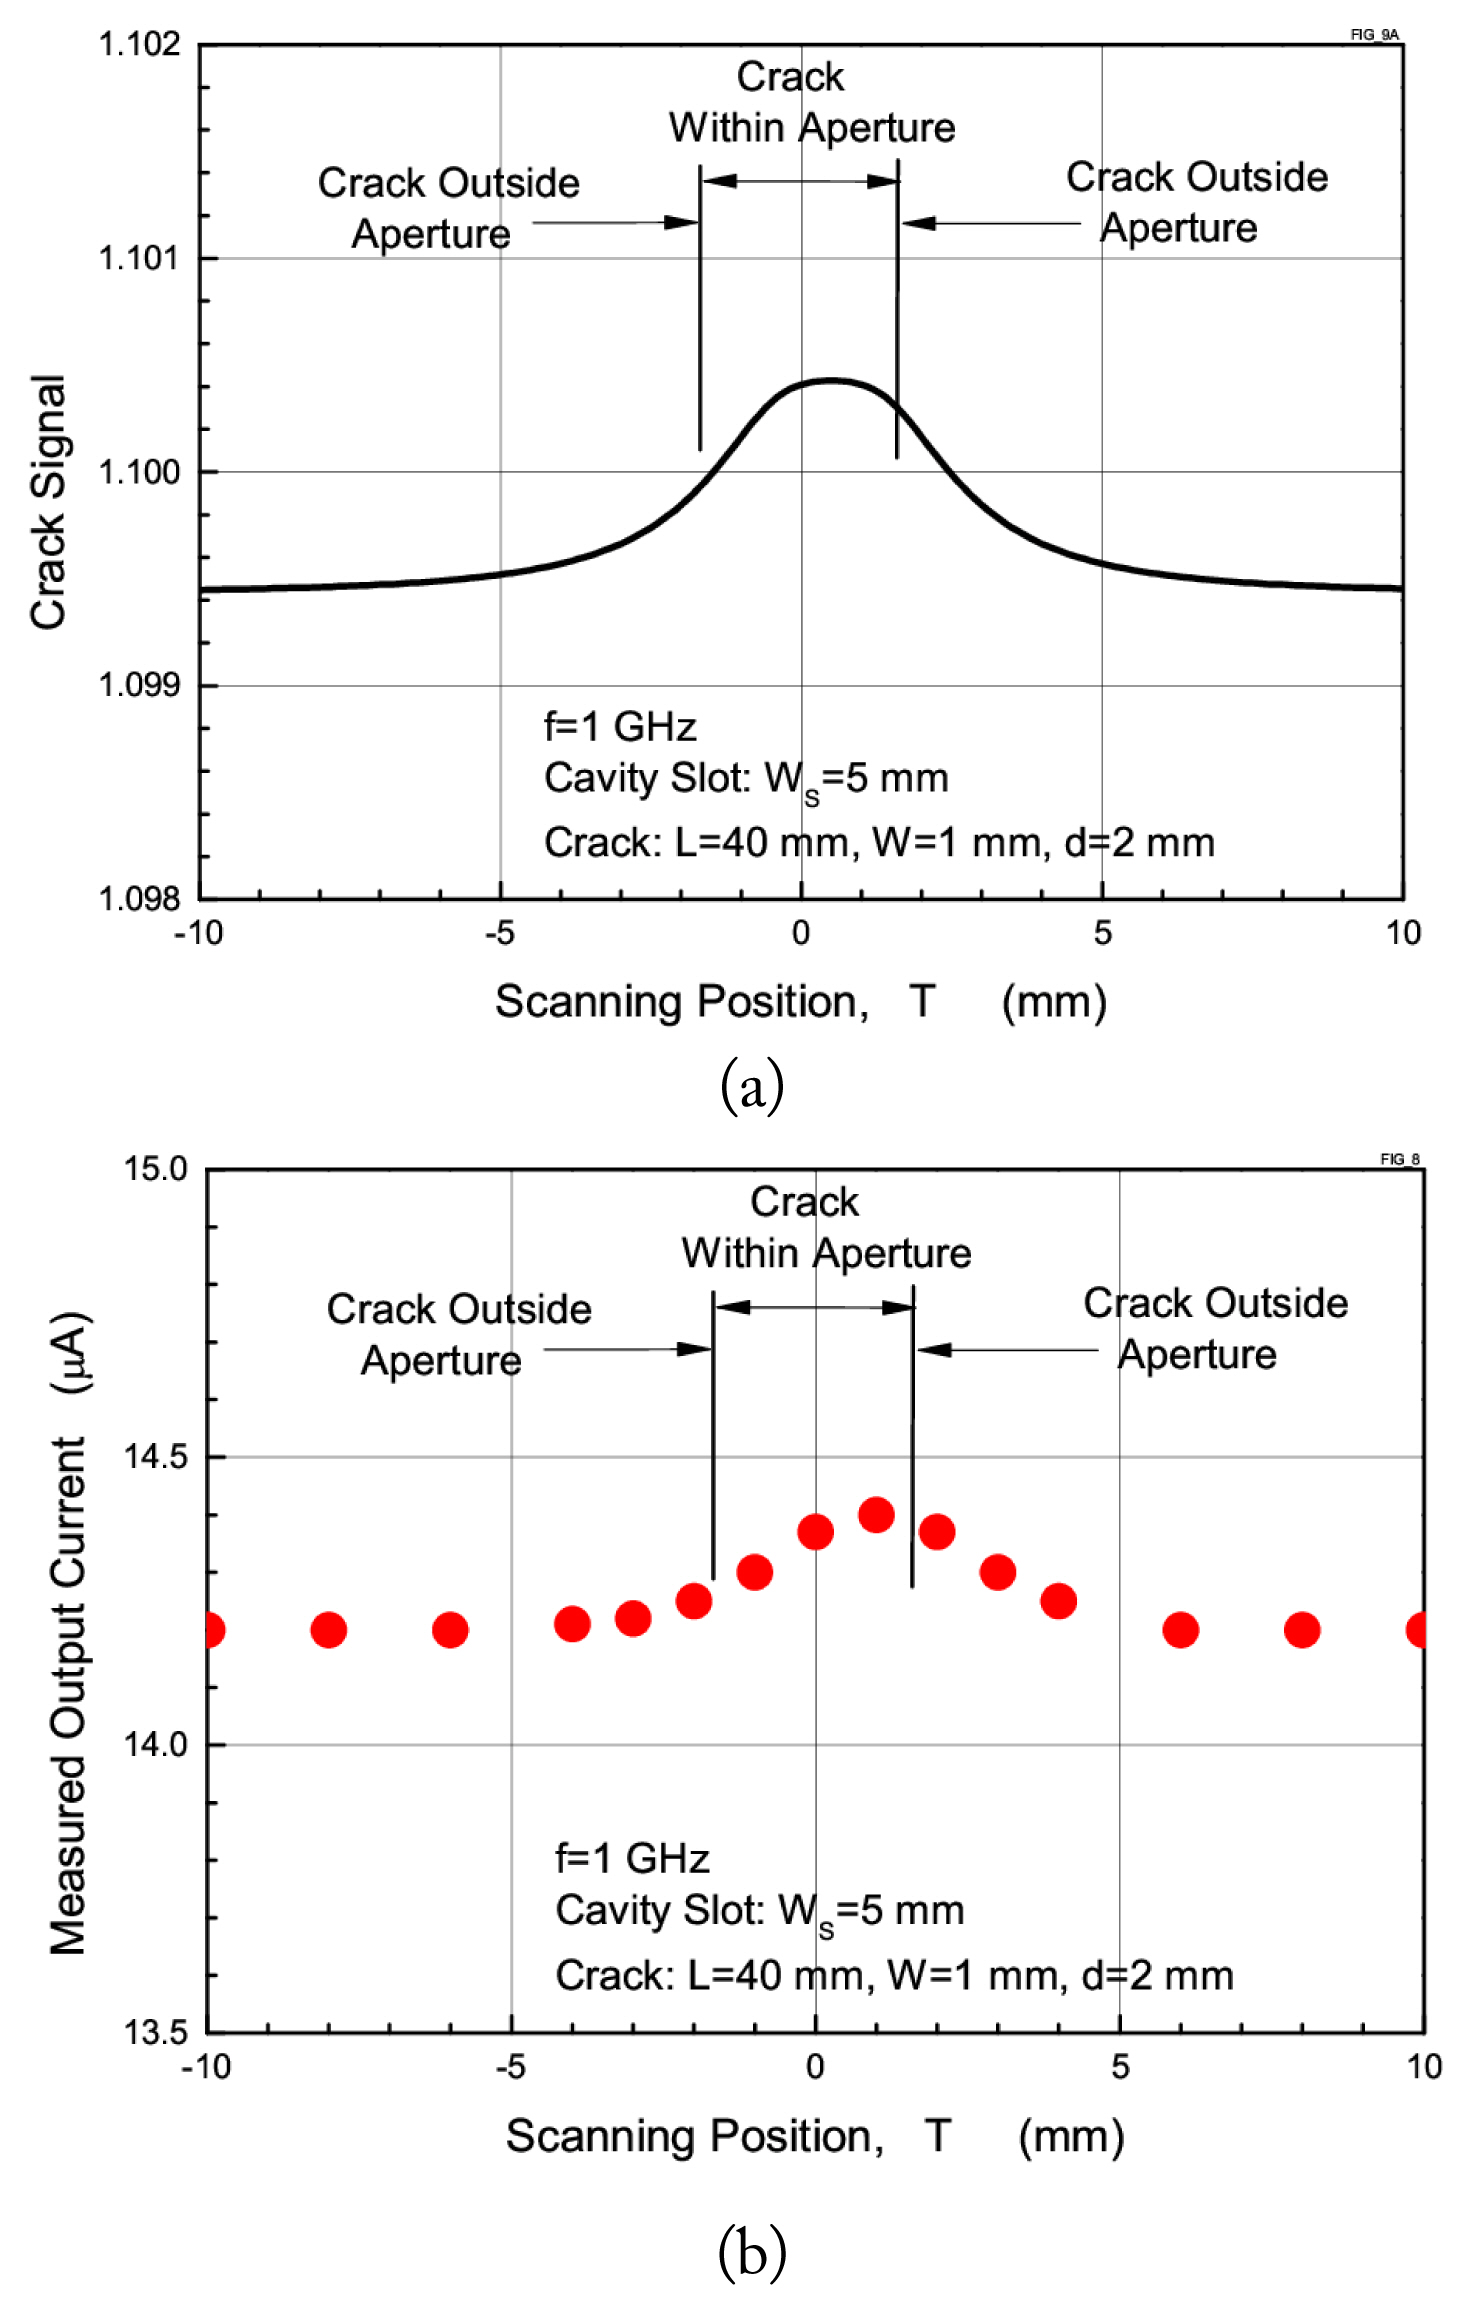
As the first step, the SR was produced by the control reactance element on the non-crack material and the signal output was recorded by the ammeter. As the second step, the cutoff-cavity probe scanned for cracks in the thick aluminum. A gradually change in the amplitude of the cavity resonance current occured when a crack appeared inside the cutoff-cavity slot aperture, as shown in Fig. 11.
Fig. 11 shows the calculated and measured crack characteristic signals for the x-directed crack. The measured crack signal was detected at a standoff distance of 1mm using the cutoff-cavity probe. A 1-mm Styrofoam sheet was used to maintain a constant lift-off distance at the constant standoff distance from the cracked material. The characteristic crack signals were detected using a single microwave frequency and SR (forced-resonance) in the cutoff cavity-backed narrow slot.
VI. Conclusion
Non-contact (remote or lift-off) crack detection using a FRMM through a cutoff cavity-backed narrow slot probe was demonstrated. The crack characteristic signals of the FRMM were evaluated theoretically and compared with the measured results. A thin-wire approximation with Galerkin’s method of moments was used to express the crack aperture field. Because the forced resonance of a cutoff cavity can be achieved by adjusting an external control element, this technique has the potential to enable the sensitive detection of cracks in metal at microwave frequencies. Future studies will investigate surface crack detection in filled and dielectric material coatings.