Multiple Step Interlaced Beam Scan to Minimize the Deviation of Radar Detection Performance
Article information
Abstract
For detection of targets, a radar conventionally scans a specified search volume with a fixed beam lattice of a specified beam spacing. With the fixed beam lattice, the detection performance of the radar within a unit beam lattice changes depending on the line-of-sight angle to a target. In this paper, multiple step interlaced scan is proposed to minimize the deviation of the detection performance due to the change of the target line-of-sight angle. As a figure of merit for the detection performance, the cumulative probability of detection is analyzed for various values of the interlaced scan step with different beam overlap ratios, and the optimal values of the steps to minimize the deviation of the cumulative probability of detection are derived.
I. Introduction
One of the major roles of a phased-array radar is to detect targets by scanning a specified search volume. The radar attempts to detect the targets by stepping beams in the search volume with a pre-defined beam lattice. The beam lattice can be formed either in a rectangular or a triangular array [1]. The total number of the beams to scan the given search volume is determined by the spacing between the adjacent beams. As the beam spacing increases, the total number of the beams decreases. This results in the reduction of a scan time, but the cost is increase of a beamshape loss [2–4]. The beamshape loss is introduced because the target is not always at the center of the beam. When the line-of-sight (LOS) angle to the target is off from the beam center, the strength of the target echo is reduced depending on the antenna beam pattern. Therefore, the beam spacing should be determined based on the trade-off between the scan time and the beamshape loss.
As a radar scans with a fixed beam lattice for the specified beam spacing, the detection performance of the radar can vary drastically depending on the LOS angle to a target, and is significantly reduced when the target is unfortunately in the middle of two adjacent beam positions. In this paper, interlaced scan with multiple steps is proposed to reduce such deviation of the detection performance. As a figure of merit for the detection performance, cumulative probability of detection is analyzed for the different steps of the interlaced scan. Then, the optimal values of the interlaced scan step to minimize the deviation are derived for different values of beam spacing.
This paper is organized as follows. In Section II, the concept of the multiple step interlaced scan is presented. In Section III, analysis methods to compare the detection performances with different steps of interlaced scan are explained. The analysis results are provided in Section IV, and Section V is the conclusion.
II. Multiple Step Interlaced Scan
In Fig. 1, a configuration of the multiple step interlaced scan is shown with Ns steps. The basic beam lattice considered in this work is designed with a beam spacing ρΔu, where ρ is the beam overlap ratio (ρ > 0) and Δu is the 1-way 3-dB beamwidth of the antenna in sine space (It is preferable to design a beam lattice in sine space, since the beamwidth does not change with scan angle in sine space [5]). The circles of each scan in Fig. 1 represent the 3-dB beamwidth contours of the beams.

Beam lattices for the multiple step interlaced scan with Ns steps.
With conventional search beam scanning, the beam positions are fixed for each scan. With multiple step interlaced scan proposed in this work, however, the beam positions in the next scan are shifted from the positions of the previous scan. For Ns step interlaced scan, the amount of the shift is ρΔu/Ns. In Fig. 1, the beam positions of the 2nd scan are shifted by ρΔu/Ns from those of the 1st scan. In case of Ns > 2, the beam positions of the 3rd scan are also shifted by ρΔu/Ns from those of the 2nd scan. Consequently, the beam positions of the
In [6], the interlaced scan with Ns = 2 was introduced to mitigate the effect of beamshape loss. However, the interlaced scan with Ns = 2 does not always guarantee the minimum deviation of the detection performance, depending on the target LOS angle. Therefore, in this work, the concept of the interlaced scan is extended to Ns ≥ 2 to minimize such deviation. Specifically, in Section IV, it is shown that Ns must be increased to minimize the deviation as ρ increases and the optimum Ns for various ranges of ρ is provided.
Although the multiple step interlaced scan can also be applied in elevation, in this work, it is applied only in azimuth for simplicity.
III. Analysis Method of Detection Performance
In this section, the analysis methods of the radar detection performance are presented. First, the antenna beam pattern model for the beam lattice design and the calculation of the beamshape loss are described. Second, the calculation for the cumulative probability of detection as a figure of merit of the radar detection performance is explained. Third, a scenario for the analysis of the detection performance is described.
1. Antenna Beam Pattern Model
To analyze the effect of the multiple step interlaced scan on the detection performance, a loss of signal-to-noise ratio (SNR) when the target is off from the beam center needs to be calculated. This beamshape loss is the reduction of the 2-way antenna gain used in radar equation, and can be calculated from the antenna beam pattern. In this work, the antenna beam pattern F(θ) is modelled with a cosine-illuminated pattern as follows [1]:
where D is the largest dimension of the antenna aperture, θ is the angle from the antenna boresight, and λ is the wavelength of the radar signal. In this work, it is assumed that D = 34λ which is a reasonable value for radar application that requires high directivity. In this case, the 1-way 3 dB beamwidth θ3dB is 2°, and therefore, Δu = sin(θ3dB) ≈ 0.035. Note that the exact value of the beamwidth is not important in the analysis of the proposed multi-step interlaced scan proposed in this work, as the optimal Ns depends on the beam overlap ratio ρ, not on the beamwidth itself.
When the target is off from the antenna beam center by θt at a single beam, the beamshape loss is 1/F2(θt) as shown in Fig. 2.

The beamshape loss of the radar against the target LOS angle from the beam center (θt).
2. Probability of Detection Calculation
Detection performance of a radar is usually given as its detection range at a specified cumulative probability of detection. The cumulative probability of detection at a range R is the probability that the radar will detect an approaching target at least once by the time the target reaches R [7]. A simple expression of the cumulative probability of detection at the nth scan Pc(n) is given by
where Pds(m) is a single probability of detection at mth scan.
The single probability of detection is a probability that the target will be detected in a single search scan. The target can be detected by more than one beam in the search scan. If there are k beams in a single scan, Pds(m) is given by
where Pd(i, m) is a single probability of detection at the ith beam of the mth scan. Note that, in this work, the detections of the beams are assumed to be uncorrelated for the calculation of Pds.
The target fluctuation model for the calculation of the probability of detection is assumed as Swerling case 1. Therefore, for a single beam, Pd is given as
where Pfa is the probability of false alarm. SNR50 and R50 are target echo SNR and range where Pd = 50%, respectively.
3. Scenario
To analyze the effect of the multiple step interlaced scan on the radar detection performance, the following scenario is considered. The radar scans the search volume of ±60° in azimuth with one elevation bar. The target approaches to the radar from the maximum range of Rmax = 300 km with a constant velocity of Vt = 500 m/s. In the calculation of the probability of detection, it is assumed that R50 = 100 km, SNR50 = 12.8 dB, and Pfa = 10−6.
The target LOS angle is fixed as the target approaches to the radar. To show how the multiple step interlaced scan reduce the deviation of the detection performance due to the target LOS angle change, three LOS angles of the target are considered as shown in Fig. 3. The three LOS angles ud (d = 1, 2, 3) are uniformly spaced from 0 to the half of the beam spacing. Therefore,

The three LOS angles of the target.
IV. Analysis Results
In this section, the cumulative probability of detection is calculated for the different values of ρ with the previously described scenario. For each ρ, the deviation of the cumulative probability of detection is compared for the different values of Ns, and the optimal Ns to minimize the deviation is derived.
1. Case for ρ = 1.0
Fig. 4 shows Pds and Pc for the different steps of the interlaced scan when ρ = 1.0. Fig. 4(a) is with Ns = 1, i.e., no interlaced scan. It is shown that, for the same range, Pc is reduced as ud increases (or in other words, as the target LOS angular distance from beam center increases). This is because the SNR is reduced due to the increase of the beamshape loss. There is no beamshape loss for the target echo signal at u1, but the beamshape loss at u3 is 6 dB. The range for Pc = 90% is decreased from 130 km to 96 km as ud changes from u1 to u3. This is not desirable, since the detection performance of the radar varies drastically depending on the target LOS angles, and is significantly degraded when the target is unfortunately close to the middle of two adjacent beam positions.
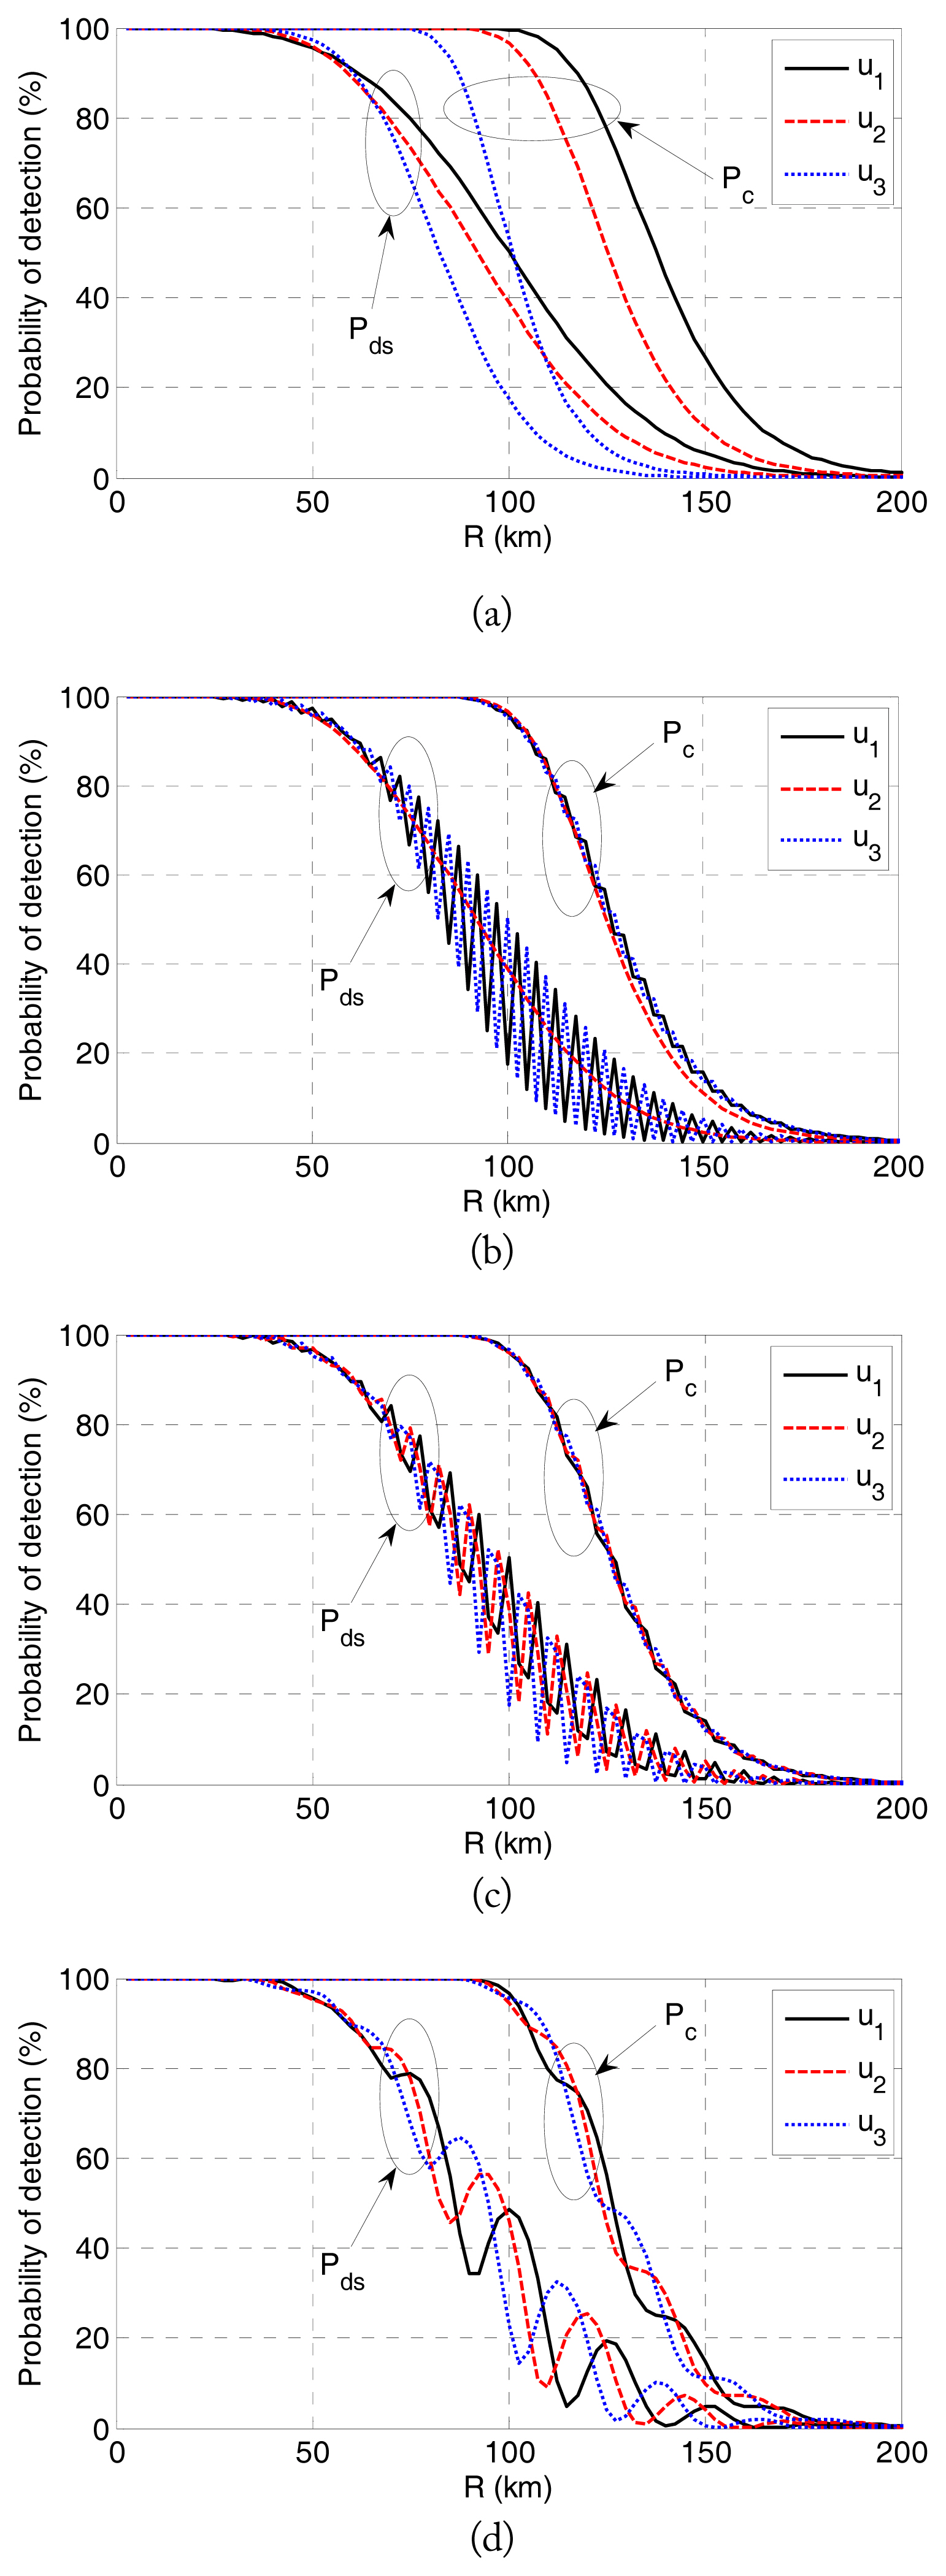
The probability of detection with ρ = 1.0: (a) no interlaced scan (Ns = 1), (b) Ns = 2, (c) Ns = 3, and (d) Ns = 10.
By introducing the interlaced scan, the deviation of Pc at the same R is reduced and unexpected degradation of the detection performance can be avoided. Fig. 4(b) shows Pds and Pc with Ns = 2. As the beam positions are interlaced between the consecutive search scans, the beamshape loss is averaged among different target LOS angles. Note that Pds curves show fluctuation where the period of the fluctuation is Ns times the single search scan time. The fluctuation is due to the change of the beamshape loss as the beam positions in each search scan is shifted by interlacing. In case of Ns = 1, no fluctuation of Pds is observed since the beam positions are always fixed. As the Pds curves fluctuate due to the effect of averaged beamshape loss by introducing multi-step interlaced scan, the Pds curves for different LOS angles of the target eventually overlap. Since the Pc directly depends on Pds, the Pc curves also overlaps. In other words, the deviation of Pc is reduced.
With Ns = 3, the deviation can be further reduced, as shown in Fig. 4(c). However, higher Ns does not always guarantee lower level of deviation. Fig. 4(d) shows Pc with Ns = 10 and it is observed that the level of deviation is increased. This is because too dense steps of interlacing (too large Ns) makes the target to be visited by beams with similar positions (thus, similar level of beamshape loss) for undesirably long time. In other words, for a given ρ, there is optimal Ns that can minimize the deviation of the cumulative probability of detection.
The level of deviation can be analyzed by comparing the highest Pc and the lowest Pc among the three target LOS angles in the same range. In Fig. 5, ΔPc (the difference between the highest Pc and the lowest Pc), are shown for the different Ns. For Ns = 2, Pc can vary up to 8.1%p at R = 141.3 km (where ΔPc = 1.9%p for Ns = 3, ΔPc = 2.3%p for Ns = 5, and ΔPc = 1.9%p for Ns = 10), but for Ns = 3, the maximum ΔPc is only 3.8%p at R = 136.3 km (where ΔPc = 7.8%p for Ns = 2, ΔPc = 4.6%p for Ns = 5, and ΔPc = 8.6%p for Ns = 10). For Ns = 5, the maximum ΔPc is increased to 4.6%p at R = 136.3 km (where ΔPc = 7.8%p for Ns = 2, ΔPc = 3.8%p for Ns = 3, and ΔPc = 8.6%p for Ns = 10). For Ns = 10, the maximum ΔPc is increased to 9.1%p at R = 135.0 km (where ΔPc = 7.5%p for Ns = 2, ΔPc = 2.6%p for Ns = 3, and ΔPc = 2.4%p for Ns = 5). The optimum Ns is the one where the maximum ΔPc in the whole range of R is the smallest, which is in this case, Ns = 3.

Deviation of cumulative probability of detection with ρ = 1.0.
2. Case for ρ = 2.0
The analysis results for ρ = 2.0 are shown in Figs. 6 and 7. Note that in Fig. 6(a) for Ns = 1, the deviation of Pc becomes more severe than that of Fig. 4(a) for ρ = 1.0. This is due to the increased beamshape loss originated from the increased beam spacing. The range for Pc = 90% is decreased from 141.5 km to 22.0 km as the target LOS angle changes from u1 to u3. As in the case with ρ = 1.0, it is observed that the deviation of Pc can be reduced by applying the interlaced scan. For Ns = 3, Pc can vary up to 33.2%p at R = 135.0 km (where ΔPc = 9.0%p for Ns = 4, ΔPc = 3.3%p for Ns = 5, and ΔPc = 6.4%p for Ns = 10), but for Ns = 4, the maximum ΔPc is only 9.6%p at R = 140.0 km (where ΔPc = 3 0.1%p for Ns = 3, ΔPc = 4.4%p for Ns = 5, and ΔPc = 6.5%p for Ns = 10). For Ns = 5, the maximum ΔPc is decreased to 5.1%p at R = 130.6 km (where ΔPc = 29.4%p for Ns = 3, ΔPc = 7.0%p for Ns = 4, and ΔPc = 8.8%p for Ns = 10). For Ns = 10, the maximum ΔPc is increased to 9.0%p at R = 135.6 km (where ΔPc = 29.0%p for Ns = 3, ΔPc = 8.3%p for Ns = 4, and ΔPc = 4.1%p for Ns = 5).

The probability of detection with ρ = 2.0: (a) no interlaced scan (Ns = 1), (b) Ns = 3, (c) Ns = 5, and (d) Ns = 10.

Deviation of cumulative probability of detection with ρ = 2.0.
Therefore, in this case, the deviation is minimized when Ns = 5 where the maximum ΔPc is 5.1%p at R = 130.6 km, as shown in Fig. 7.
3. Optimal Ns
In Fig. 8, the maximum values of ΔPc are calculated for Ns from 1 to 10 for the different values of ρ. It is observed that the optimal Ns to minimize the maximum ΔPc varies depending on ρ. In Table 1, the optimal values of Ns for the different ranges of ρ are summarized. It is shown that Ns = 1 (the conventional scan with fixed beam lattice) is not optimum for any value of ρ, and Ns = 2 is optimum only when ρ ≤ 0.8. When ρ > 0.8, Ns needs to be increased to minimize the deviation of Pc.

The maximum deviation of the cumulative probability of detection for the different beam overlap ratios.
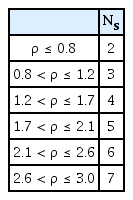
The optimal Ns to minimize the deviation of the cumulative probability of detection for various values of ρ
V. Conclusion
In this work, it has been shown that the deviation of the radar detection performance for different target LOS angle can be reduced by applying multiple step interlaced scan. By comparing the cumulative probability of detection with different values of the interlaced scan step, the optimal interlaced scan steps to minimize the deviation of the detection performance have been derived for various beam overlap ratios. By applying the proposed multiple step interlaced scan, it is expected that a radar engineer can design a radar with more stable detection performance.
Although the optimum Ns has been derived based on parametric studies of Ns and ρ, more theoretical analysis methods to derive the optimum Ns can be investigated as a future work.
References
Biography

Ji Hwan Yoon received the Ph.D. degree in Electrical and Electronic Engineering from Yonsei University, South Korea, in 2016. Since March, 2016, he has been with the Agency for Defense and Development, South Korea, where he is currently a senior researcher. His research interests include airborne radar systems, phased array radars, and reflectarrays.

Yeonhee Pak received the M.S. degree in Electrical and Electronic Engineering from Yonsei University, South Korea, in 2016. Since March, 2016, he has been with the Agency for Defense and Development, South Korea, where he is currently a Principal researcher. Her research interests include airborne radar systems.

Ji Eun Roh received the Ph.D. degree in Computer Science and Engineering from POSTECH, South Korea, in 2006. Since March, 2006, she has been with the Agency for Defense and Development, South Korea, where she is currently a principal researcher. Her research interests include Airborne AESA radar system, radar resource management, and radar data processing.

Sung Chul Park received the M.S. degree in Electronic Engineering from Kwangwoon University, South Korea, in 1990. Since March, 1990, he has been with the Agency for Defense and Development, South Korea, where he is currently a principal researcher. His research interests include radar system design, radar signal processing, and radar data processing.