 |
 |
- Search
| J. Electromagn. Eng. Sci > Volume 22(3); 2022 > Article |
|
Abstract
Synthetic aperture radar (SAR) specializes in capturing two-dimensional images of Earth’s surface. Because satellites or aircraft have mainly been used as SAR platforms, pulse radar systems with high peak transmitted power have been preferred for long-range detection. However, because systems based on pulse radar are generally too heavy and expensive, lightweight and low-cost frequency-modulated continuous-wave (FMCW) radar systems have attracted increasing interest, and many studies on FMCW SAR signal processing are being conducted. The pulse duration of FMCW radar is considerably longer than that of pulse radar. Therefore, it is necessary to determine whether stop-and-go approximation (SAG) is still valid for FMCW radar. If SAG is not applicable, an additional, time-consuming range cell migration correction process is required. In this study, the conditions under which SAG can be applied to FMCW SAR were analyzed. Moreover, Ku-band FMCW SAR field tests were conducted to experimentally validate the feasibility of SAG. Several quantitative parameter values demonstrating the advantages of applying SAG were identified.
Early synthetic aperture radar (SAR) systems were primarily mounted on satellites. Thus, to cover long ranges between satellites and Earth’s surface, pulse radar was preferred. However, due to the increasingly small-scale observation areas and the emergence of SAR platforms such as automobiles and unmanned aerial vehicles, the demand for compact frequency-modulated continuous-wave (FMCW) radar with low-transmission power and cost-effective properties has increased. Accordingly, research on FMCW SAR signal processing algorithms has also increased [1–12].
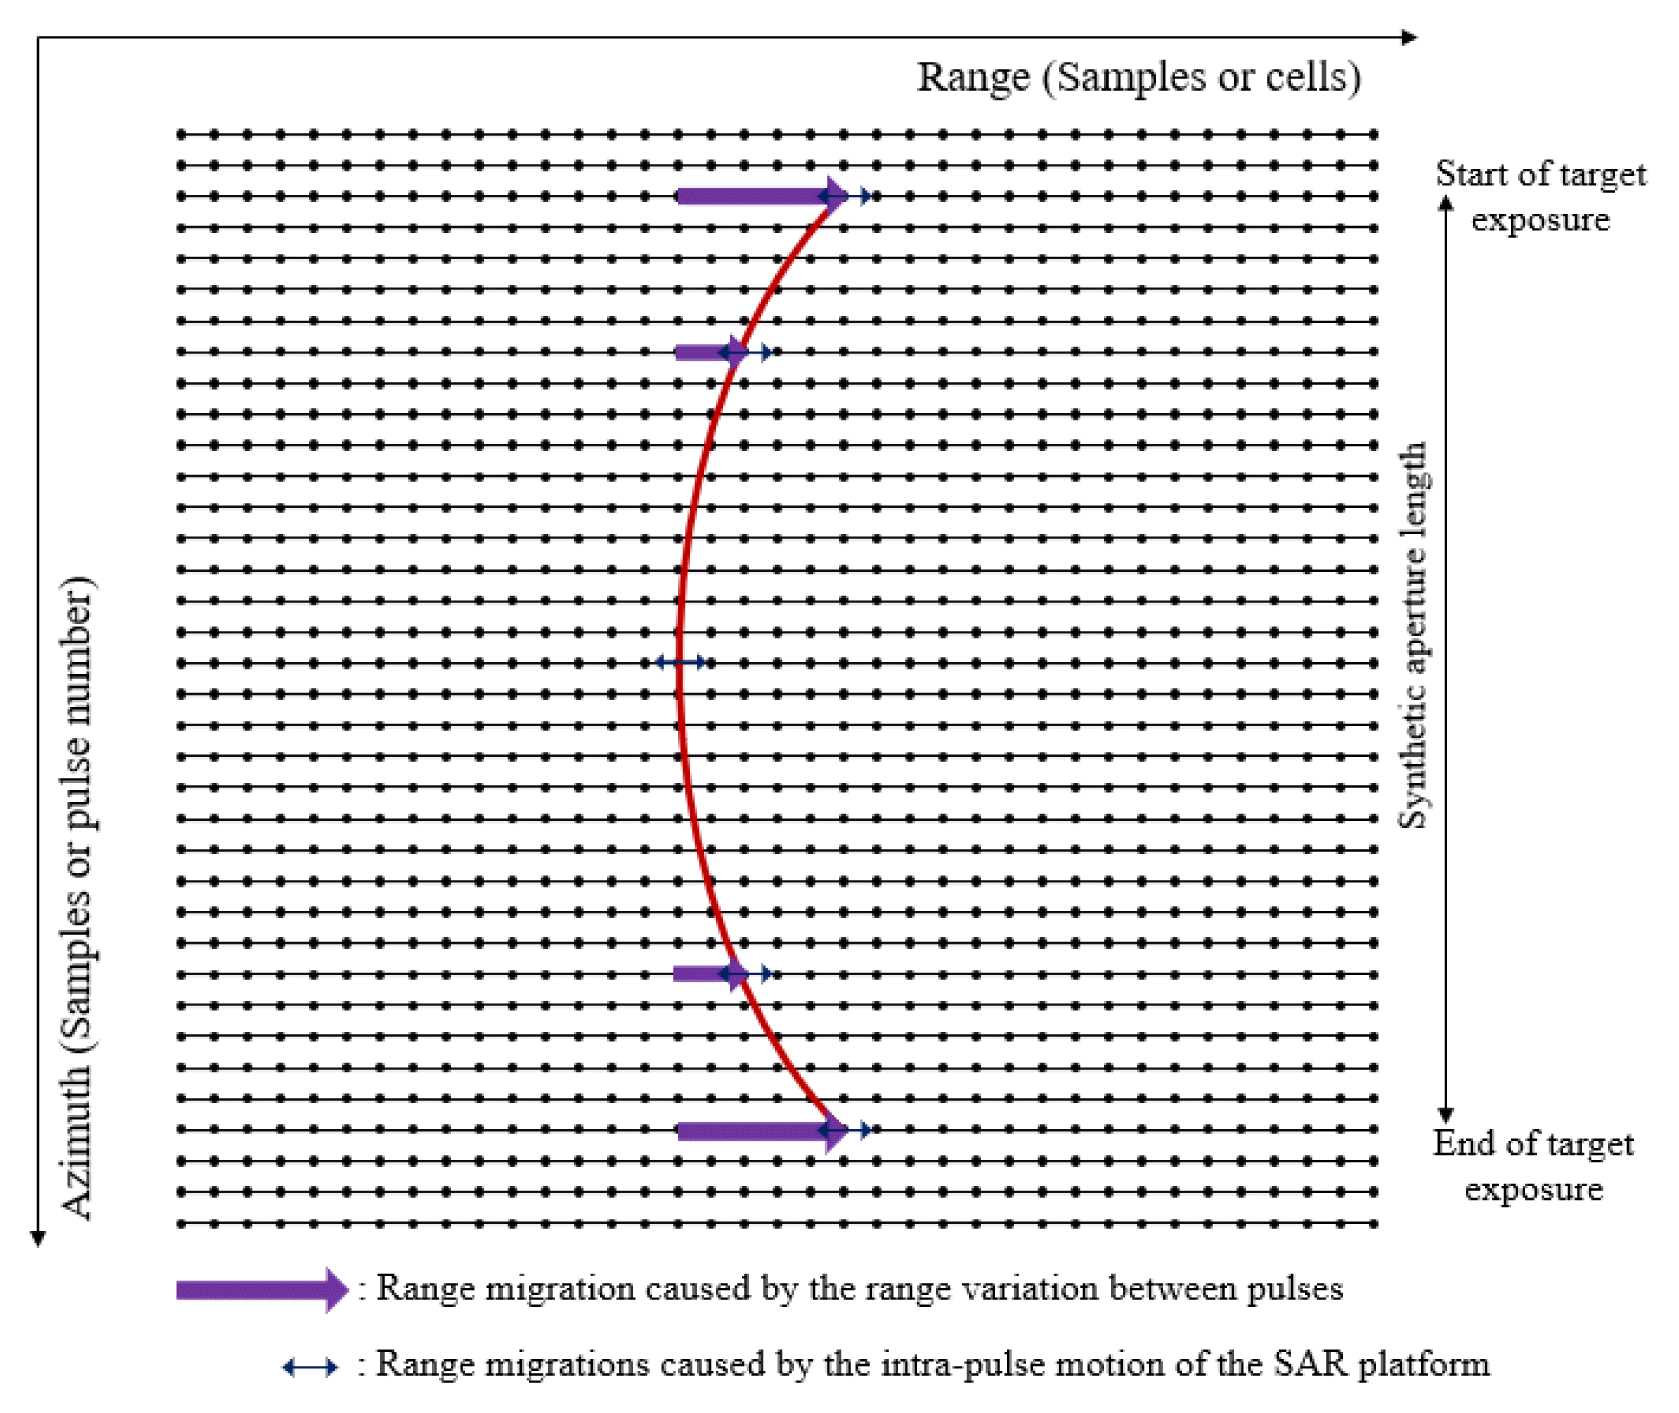
SAR signal processing aims to determine the exact range and azimuth position of targets by compressing raw data in the range and azimuth direction. Azimuth resolution of SAR image greatly depends on the Doppler (azimuth) bandwidth of the signal. However, range cell migration (RCM) inevitably occurs during SAR data acquisition, resulting in azimuth resolution degradation due to the loss of the Doppler bandwidth. Therefore, before performing azimuth processing, it is necessary to align the azimuth phase information of a target to a single azimuth line to make the most of the Doppler bandwidth for the target. This correction process is called range cell migration correction (RCMC). Fig. 1 shows the bending of the energy trajectory of a single target according to RCM.
RCM mainly occurs because the range between the radar and the target varies for each pulse during the SAR integration time. This is the range migration that occurs between pulses. Moreover, since the platform is in motion, frequency shifts due to the relative velocity, and the range variation over the pulse duration may cause additional range migrations. This is the range migration caused by the intra-pulse motion of the SAR platform.
In pulse SAR, the pulse duration is short enough to be assumed that the radar platform is fixed during transmission and reception. Therefore, RCM originating from the latter is negligible in pulse SAR. This assumption is called the stop-and-go approximation (SAG). However, the pulse duration of FMCW radar is relatively long compared to pulse radar. Therefore, it is uncertain whether SAG is still applicable. If SAG cannot be applied, an additional RCMC process is required to compensate for the additional RCM caused by the intra-pulse motion of the SAR platform.
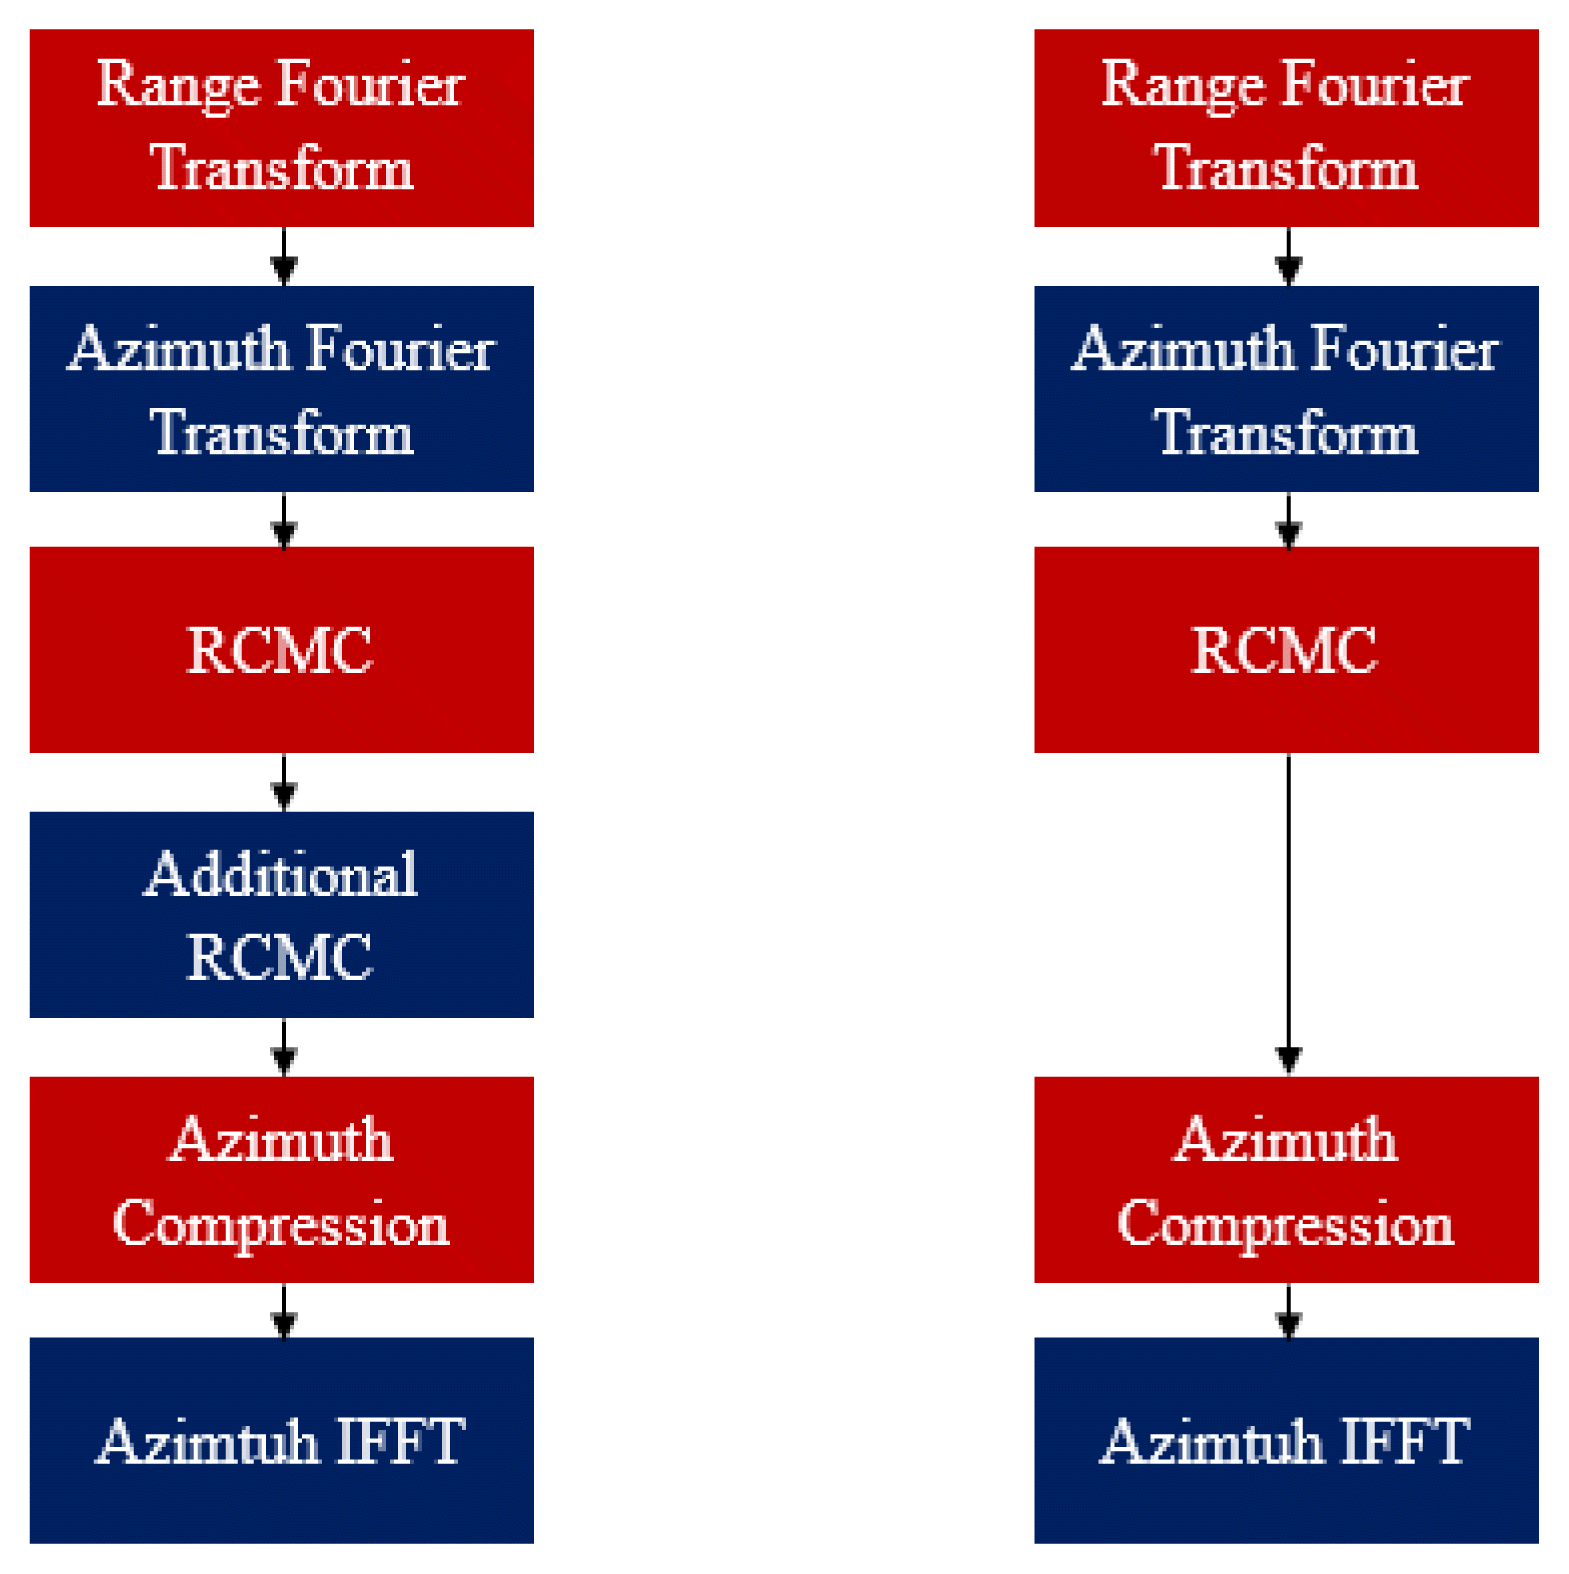
In this study, the range-Doppler algorithm (RDA) was used as a signal processing scheme because it is accurate, efficient, and the most widely used in SAR processing [13]. Fig. 2 shows block diagrams of RDA for FMCW SAR according to whether SAG is applied or not. As shown in Fig. 2(b), the additional RCMC process is omitted when SAG is applied. In general, RCMC involves an interpolation process that requires considerable computational loads [13]. Therefore, the processing time can be greatly reduced if SAG is applied to FMCW SAR.
In some studies, a platform motion during transmission and reception has been considered negligible in the FMCW SAR [2–4]. In other studies, SAG has been considered inapplicable to FMCW SAR [5–8]. Few of these studies have analytically determined whether SAG is applicable, and none have done so experimentally based on actual raw data [2–8]. Therefore, in this study, the conditions under which SAG can be applied to FMCW SAR were analyzed and experimentally confirmed through Ku-band FMCW SAR field tests.
This paper is organized as follows. In Chapter II, a review of the FMCW radar signal model is introduced, and the conditions for applying SAG in FMCW SAR are analytically derived. Chapter III presents the experimental results of Ku-band FMCW SAR field tests. It also presents comparisons of SAR quality parameters and processing times to confirm the applicability of SAG to FMCW SAR and its advantages. Finally, the conclusion of this paper is given in Chapter IV.
This chapter provides a review of the FMCW radar signal model to determine the range resolution. Linear frequency modulation and sawtooth sweep type are assumed. The transmission signal is
where fc is the carrier frequency, T is the pulse repetition interval (PRI), t is the time variable within T, and K is the linear chirp rate. K is given as
where B is the sweep bandwidth of the transmitted signal. The reflected signal from the object with the range R is determined as
where τ is the signal round-trip time, and c is the speed of light. This reflected signal is mixed with a replica of the transmitted signal in the radar receiver. The beat signal, is given as
Since the only phase term related to time t is the second term, the beat frequency after applying a Fourier transform is calculated as
It can be seen that the beat frequency in the FMCW radar receiver is proportional to its distance from the object. The relation between the frequency resolution and T is
As mentioned in Chapter I, the pulse duration of FMCW radar is relatively long compared to pulse radar. Therefore, it should be determined whether SAG can be applied to FMCW SAR. Since the platform is in motion during the pulse duration, additional range migrations occur for two reasons. One reason is the frequency shift due to the relative velocity, and the other is the range variation over the pulse duration. For SAG to be applicable to FMCW SAR, these range migrations must be less than the range resolution of the radar.
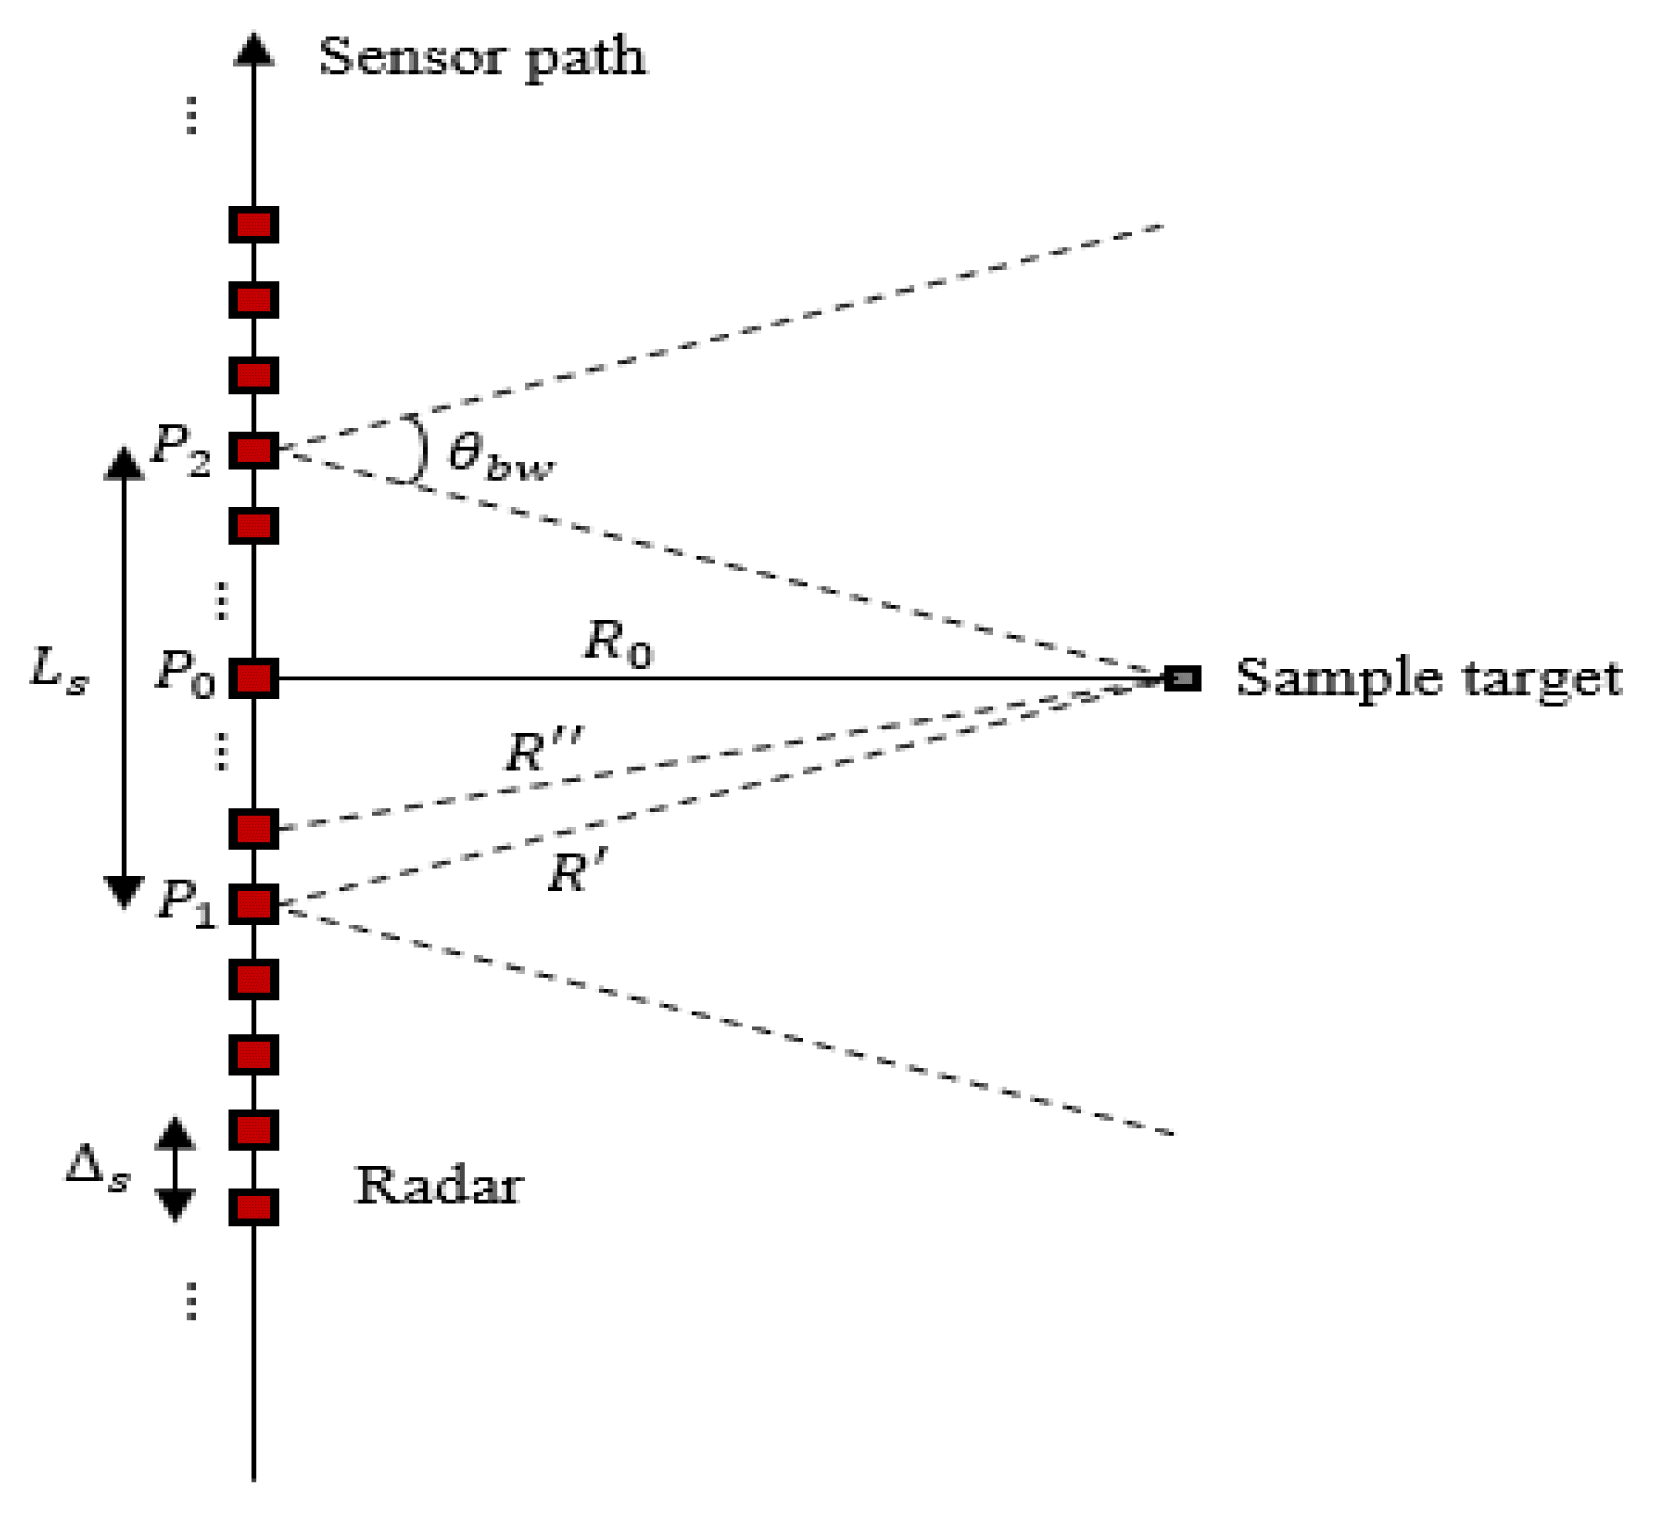
First, the range migration, caused by the frequency shift due to the relative velocity, is discussed. A radar data acquisition geometry is shown in Fig. 3. For convenience, a zero squint case is assumed. Ls is the synthetic aperture length, θbw is the antenna beamwidth in the azimuth direction, P0 is the position of closest approach, R0 is the range of closest approach, and Δs is the sample spacing of the synthetic aperture signal. The sample target is continuously detected by the radar while it is in the beam illuminated area. P1 is the position of the radar when the sample starts entering the beam illuminated area, and P2 is the position of the radar when the sample exits the beam illuminated area. That is, the sample is detected while the radar is between P1 and P2. Since the distance between P1 and P2 is Ls, the positions of P1 and P2 can be specified as points separated by half the Ls from P0. As shown in Fig. 3, Ls is determined from θbw and R0 as
As the platform moves along the sensor path, the sample is detected by each pulse with a different Doppler frequency. The Doppler frequency shift caused by the relative velocity of the radar and the target is [13]:
where fd is the Doppler frequency shift, Vs is the radar platform velocity, θ is the angle measured from boresight in the slant range plane, and λ is the radar wavelength. As represented in Eq. (5), in FMCW radar processing, the beat frequency is proportional to the range. Therefore, the Doppler frequency shift of the FMCW signal indicates range migration. By substituting Eq. (9) to Eq. (5), the range migration caused by the frequency shift due to the relative velocity can be determined as
where Rd is the range migration caused by the Doppler frequency shift and f is the radar frequency. Since the Doppler frequency shift is the largest when the platform is located at P1 or P2, the maximum value of Rd is determined as
Second, the range migration, caused by the range variation over the pulse duration, is discussed. Range migration due to range variation Rr can be defined as the difference between the range at the pulse start time and the range at the pulse end time (after one PRI). As illustrated in Fig. 3, the range between the radar and the sample when the radar is located at P1 is R′ which is determined as
Ts is the SAR observation time. Since the platform is in motion, this range changes continuously over the pulse duration. After a PRI, the range between the radar and the sample becomes R″ which is determined as
Therefore, the range migration caused by the range variation during the pulse duration can be calculated as
This is the maximum value of Rr because when the radar moves to a position other than P1, the range migration of the sample is less than Rr,max. Meanwhile, given that Ts consists of many PRIs, Rr,max is rewritten as
where N is the number of pulses that constitutes Ts. When the radar moves from P1 to P0 (approaching the sample), Rd has a positive value, meaning that range migration occurs in the away direction. Rr also has a positive value, but it means that the range migration occurs in the opposite direction. Therefore, the total range migration is
On the other hand, when the radar moves from P0 to P2 (away from the sample), Rd has a negative value, meaning that range migration occurs in the forward direction. Rr also has a negative value, but it means that range migration occurs in the away direction. Therefore, the total range migration is the same as in Eq. (16).
Thus far, the range resolution and the range migration due to the motion of the platform during the pulse have been defined. For SAG to be applicable to FMCW SAR, the total range migration Rm should be less than the range resolution of the radar ΔR. Thus, the following condition must be satisfied:
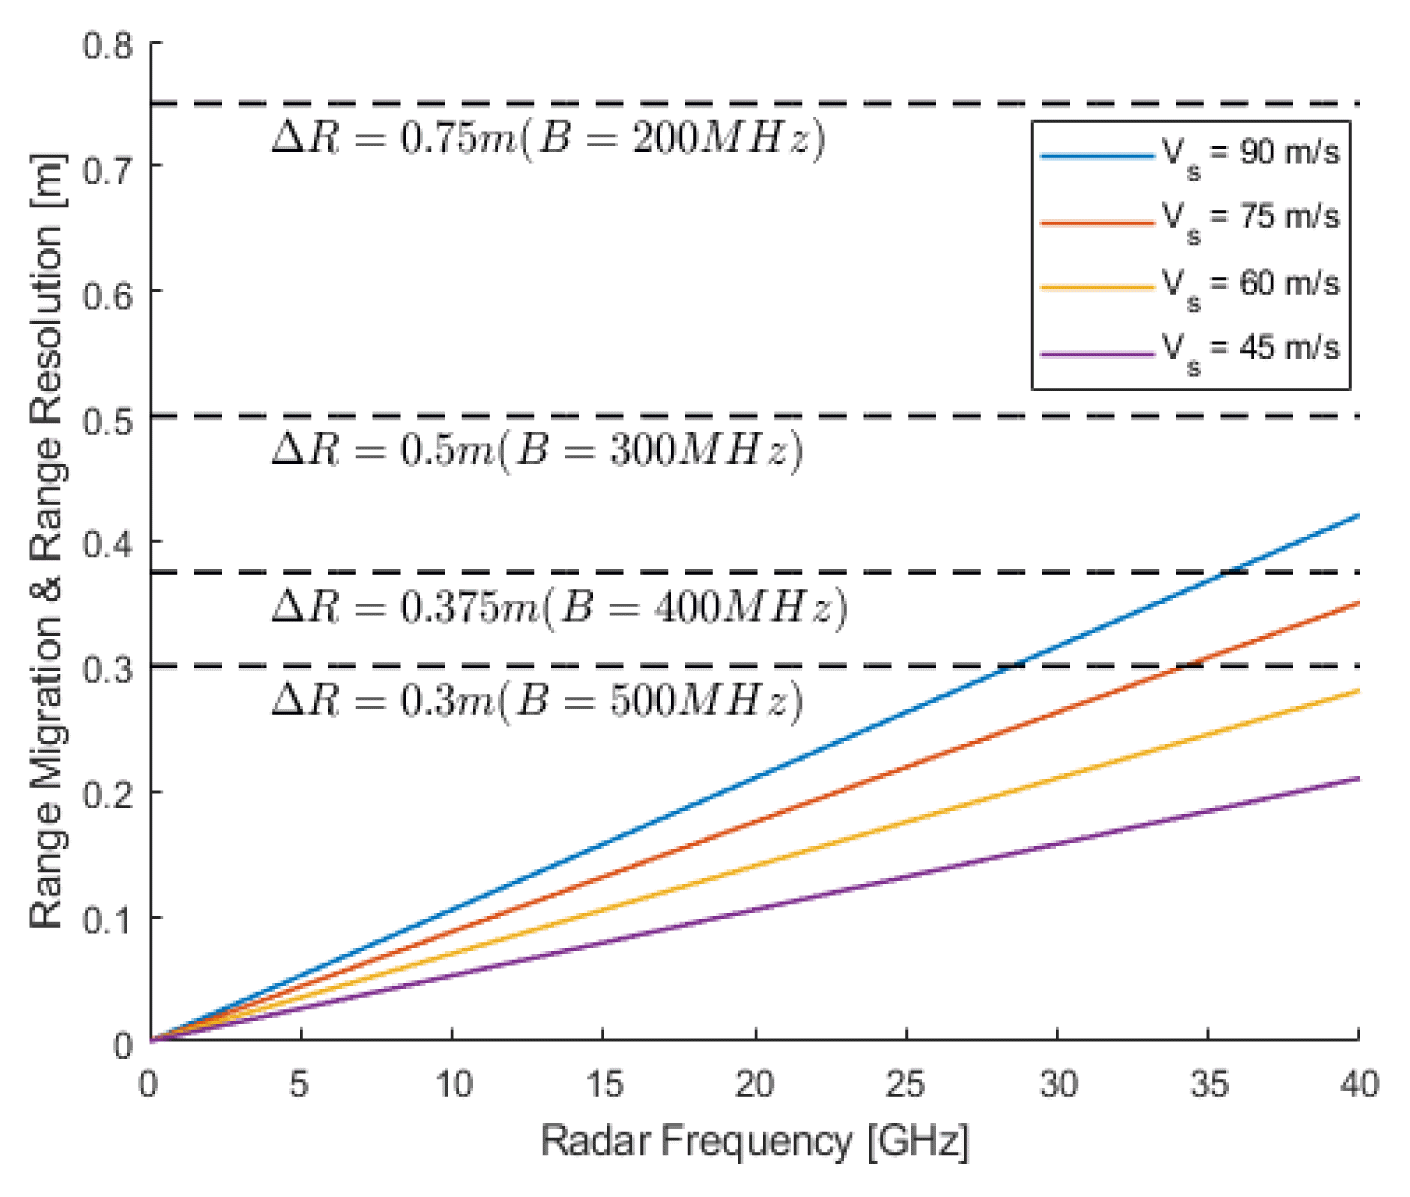
Fig. 4 shows the range migration (solid lines) as a function of frequency at different radar platform velocities and the range resolution (dashed lines) as a function of frequency bandwidth. For simplicity, a linear chirp rate of K = 2.5 THz/s and an antenna beamwidth of θbw= 34° are assumed. In addition, as will be discussed in Chapter III,Rr is not considered because its value is almost zero. On the other hand, for a fixed value of K, as T decreases, B also decreases, and ΔR degrades (i.e., widens). This is in line with the fact that SAG is valid for pulse radar with a short pulse duration. Notably, a value of Vs = 90 m/s is almost the fastest velocity available in FMCW SAR [1, 4, 7, 9–12]. This is because FMCW SAR is used only on aircraft or automobile platforms due to its detection range limitation
As shown in Fig. 4, range migration increases as the range frequency and radar platform velocity increases. Also, the wider the frequency bandwidth, the better (narrower) the range resolution. Therefore, the most difficult case to apply SAG to FMCW SAR is when the system has high-frequency, high platform velocity, and high range resolution properties. By comparing the expected range migration with the range resolution, it is possible to determine whether SAG is applicable to FMCW radar with certain system specifications. SAG can be applied to FMCW SAR in the Ku-band frequency region (12–18 GHz), even in the case of high ΔR (0.3 m) and high Vs (90 m/s) because the range migration in that region is considerably smaller than the range resolution. On the other hand, SAG is not applicable to FMCW SAR in the Ka-band frequency region (27–40 GHz) in the case of high ΔR (0.3 m) and high Vs (90 m/s) and can be applied only if Vs decreases or ΔR widens. Therefore, the system specifications should be considered to determine whether SAG is applicable to a given FMCW SAR system.
Chapter III presents range migration and range resolution calculations with actual Ku-band FMCW SAR system specifications. Also, it presents filed test demonstrating that SAG is applicable to Ku-band FMCW SAR even in tough cases.
The detailed specifications of the Ku-band FMCW SAR system used in the outdoor experiments are given in Table 1. The center frequency of the FMCW radar is in the Ku-band (14.25 GHz). The frequency bandwidth of the radar system is 500 MHz, which leads to a high ΔR (0.3 m). To avoid the limitations of a single scenario, experiments were performed at various radar platform velocities (82, 75, 63, and 45 m/s). In Fig. 5, since the expected range migration values are below the range resolution line, SAG is applicable to all cases. The applicability of SAG to a specific FMCW SAR system can be confirmed by directly calculating the additional range migration and the range resolution using the equations presented in Chapter II. The case of a radar platform velocity of 75 m/s is considered below.
In our system specification, using Eq. (11), the maximum range migration caused by the frequency shift due to the relative velocity Rd,max was 0.125 m, which was less than the range resolution ΔR. This value was consistent with the expected range migration value for the case of Vs = 75 m/s in Fig. 5. Moreover, since Ts consists of thousands of PRIs, Rr is almost zero and, therefore, negligible. In fact, using Eq. (15), the maximum range migration Rr,max caused by the range variation over the pulse duration was about 0.0044 m, which is considerably less than the range resolution. This means that SAG was applicable to our FMCW SAR system case, as shown by the calculation of Eq. (17).
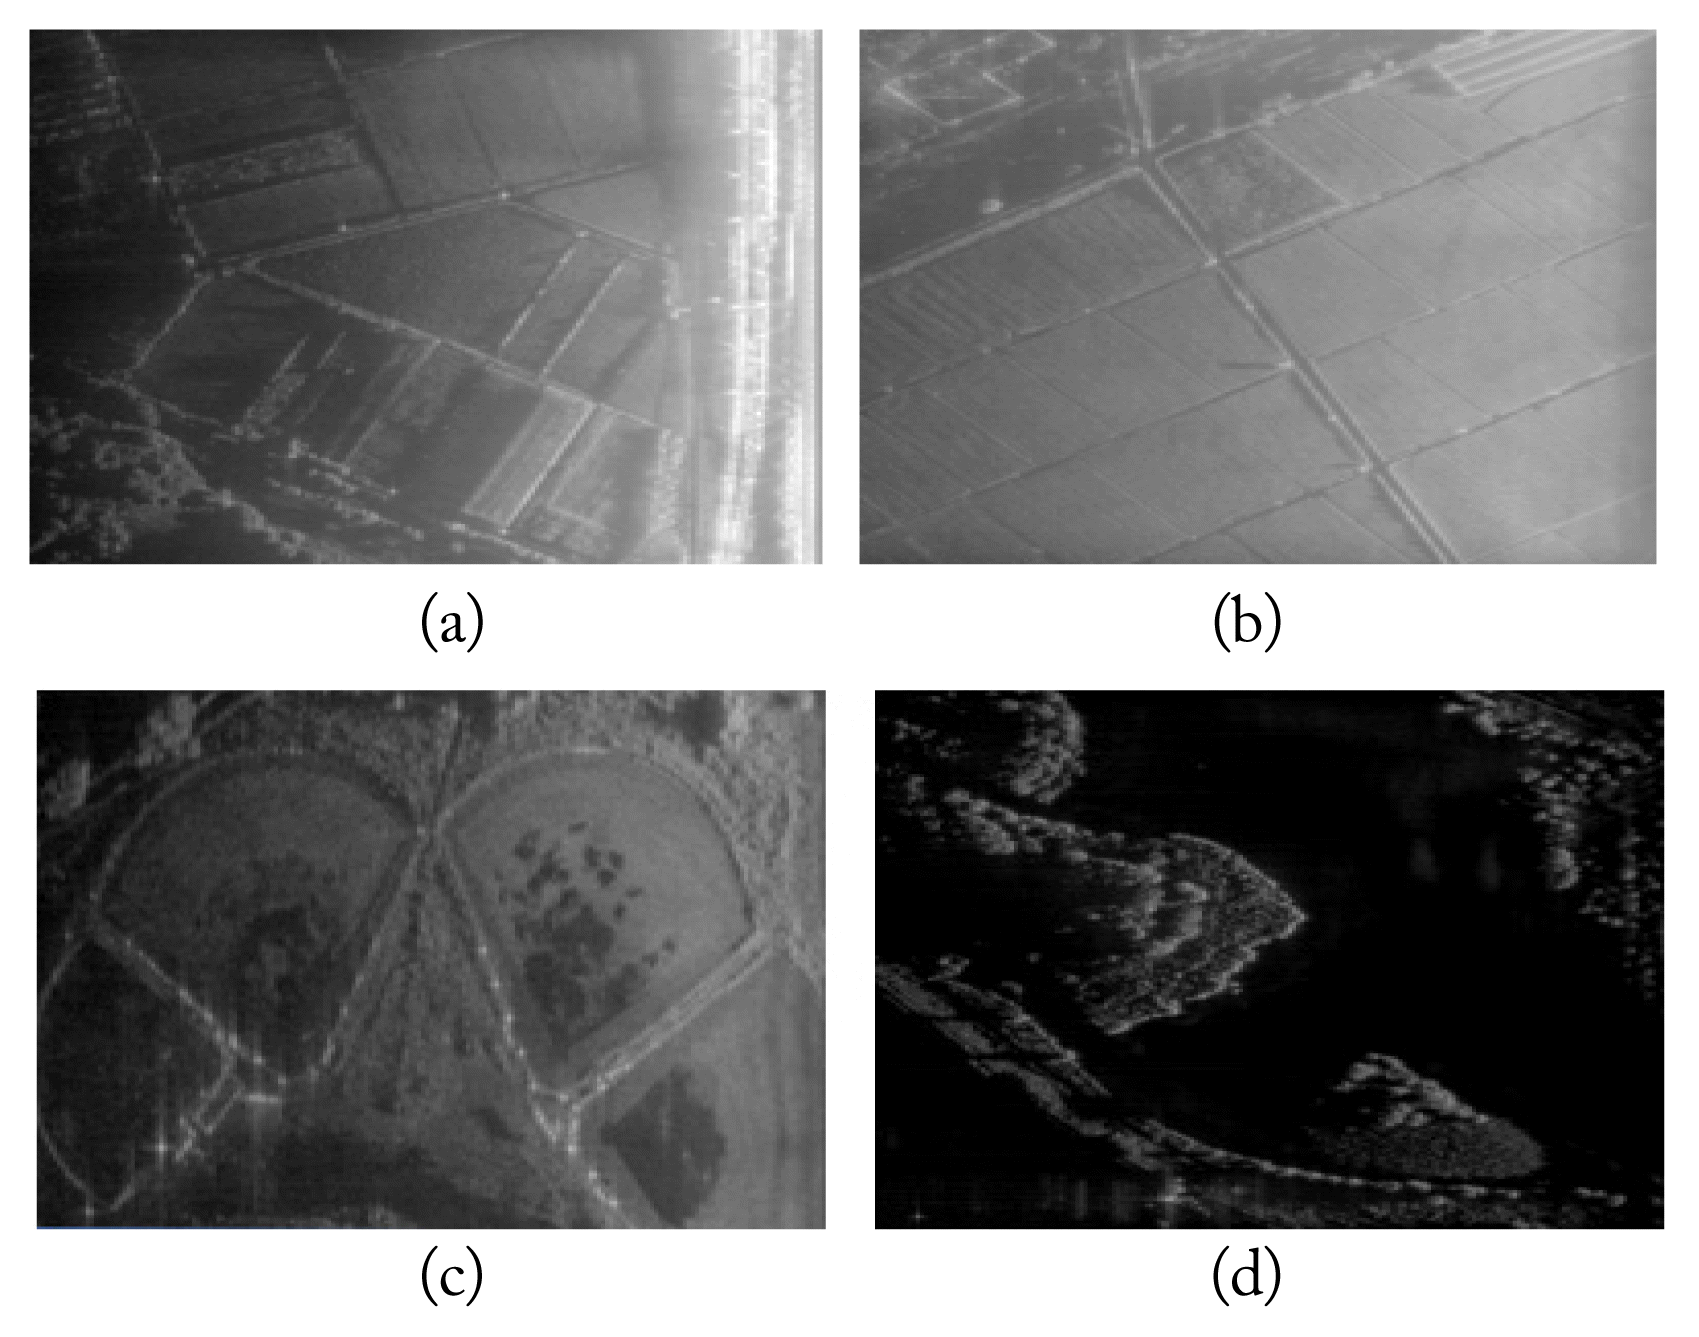
To experimentally verify the applicability of SAG to FMCW SAR, SAR signal data were obtained from several test sites at various platform velocities. Appropriate SAR images appeared after processing SAG-applied RDA in the actual raw dataset. Fig. 6 shows the Ku-band FMCW SAR images. The SAR images match the aerial photographs of the test sites shown in Fig. 7, providing experimental evidence that our specific Ku-band FMCW SAR can work with SAG.
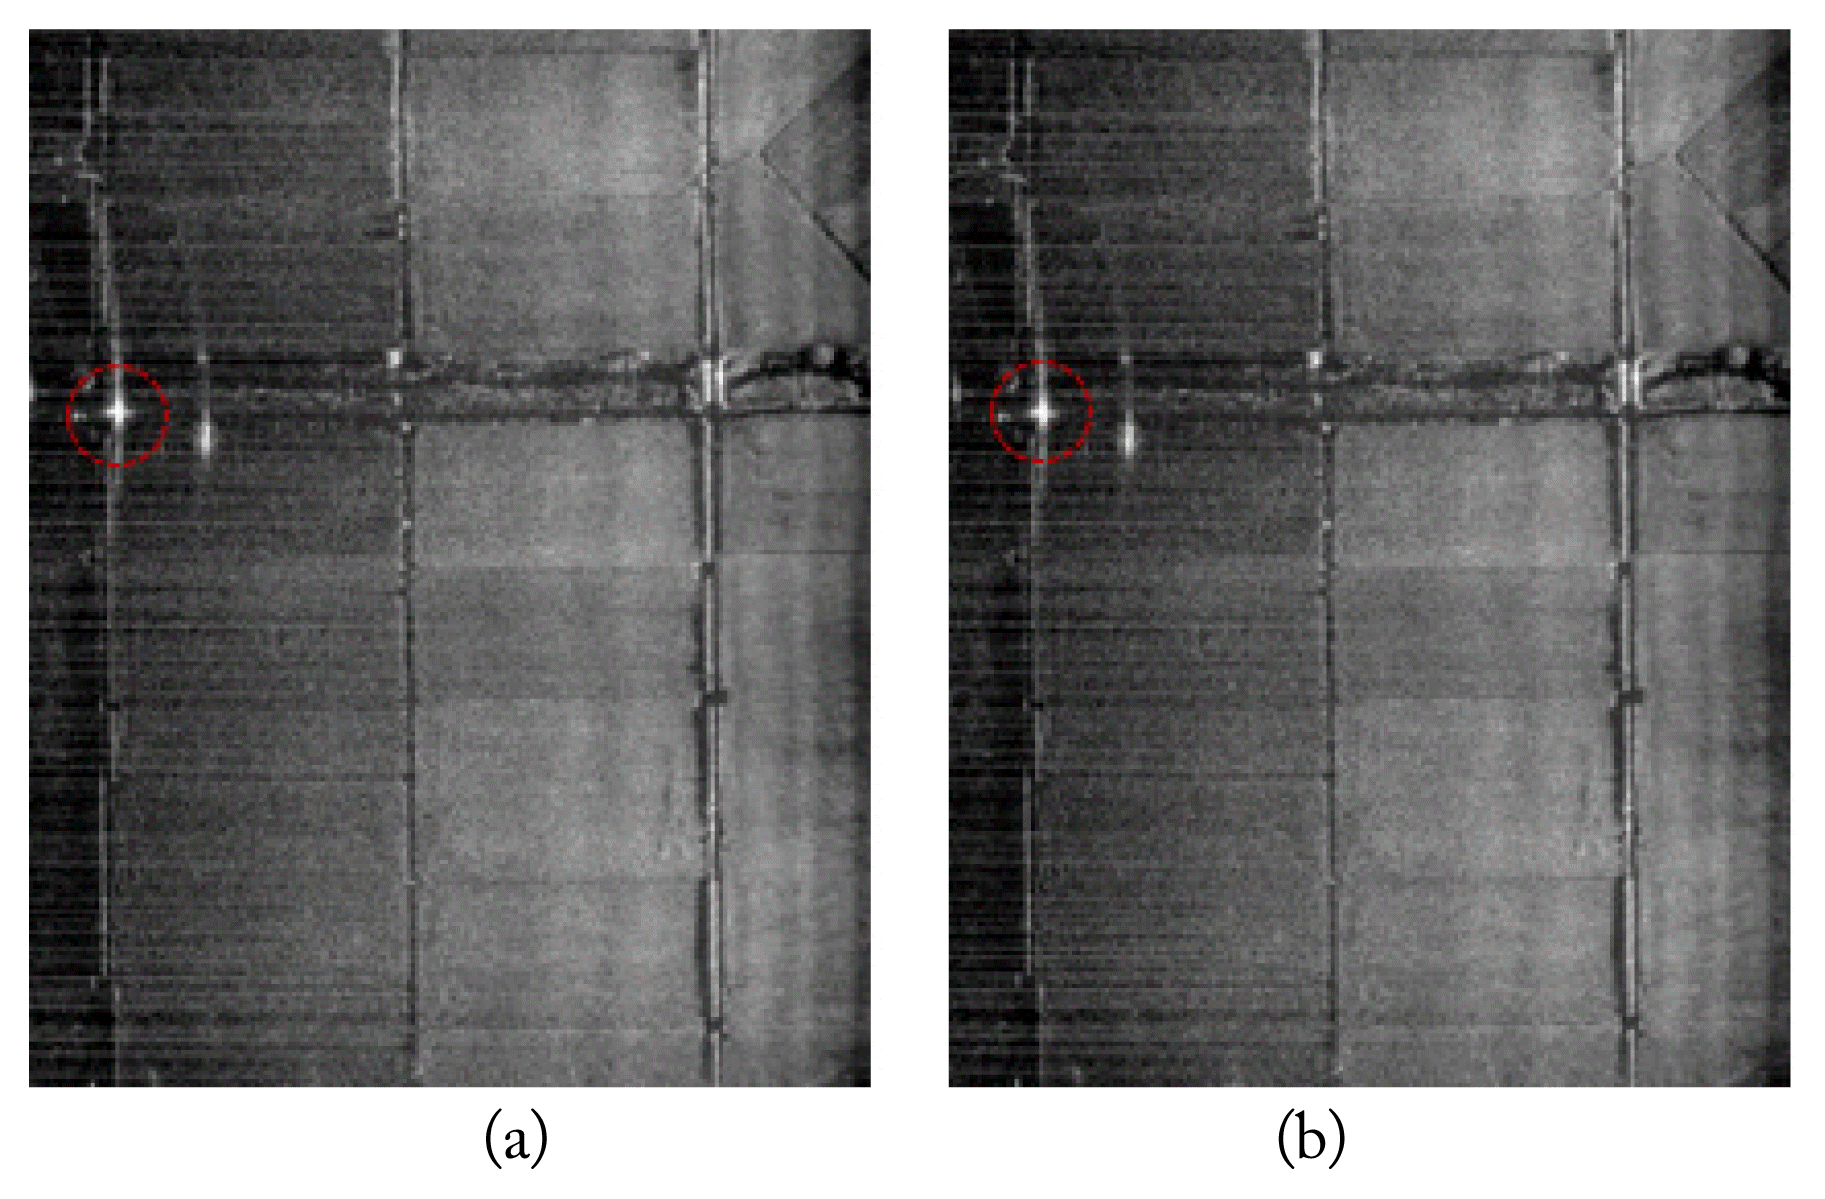
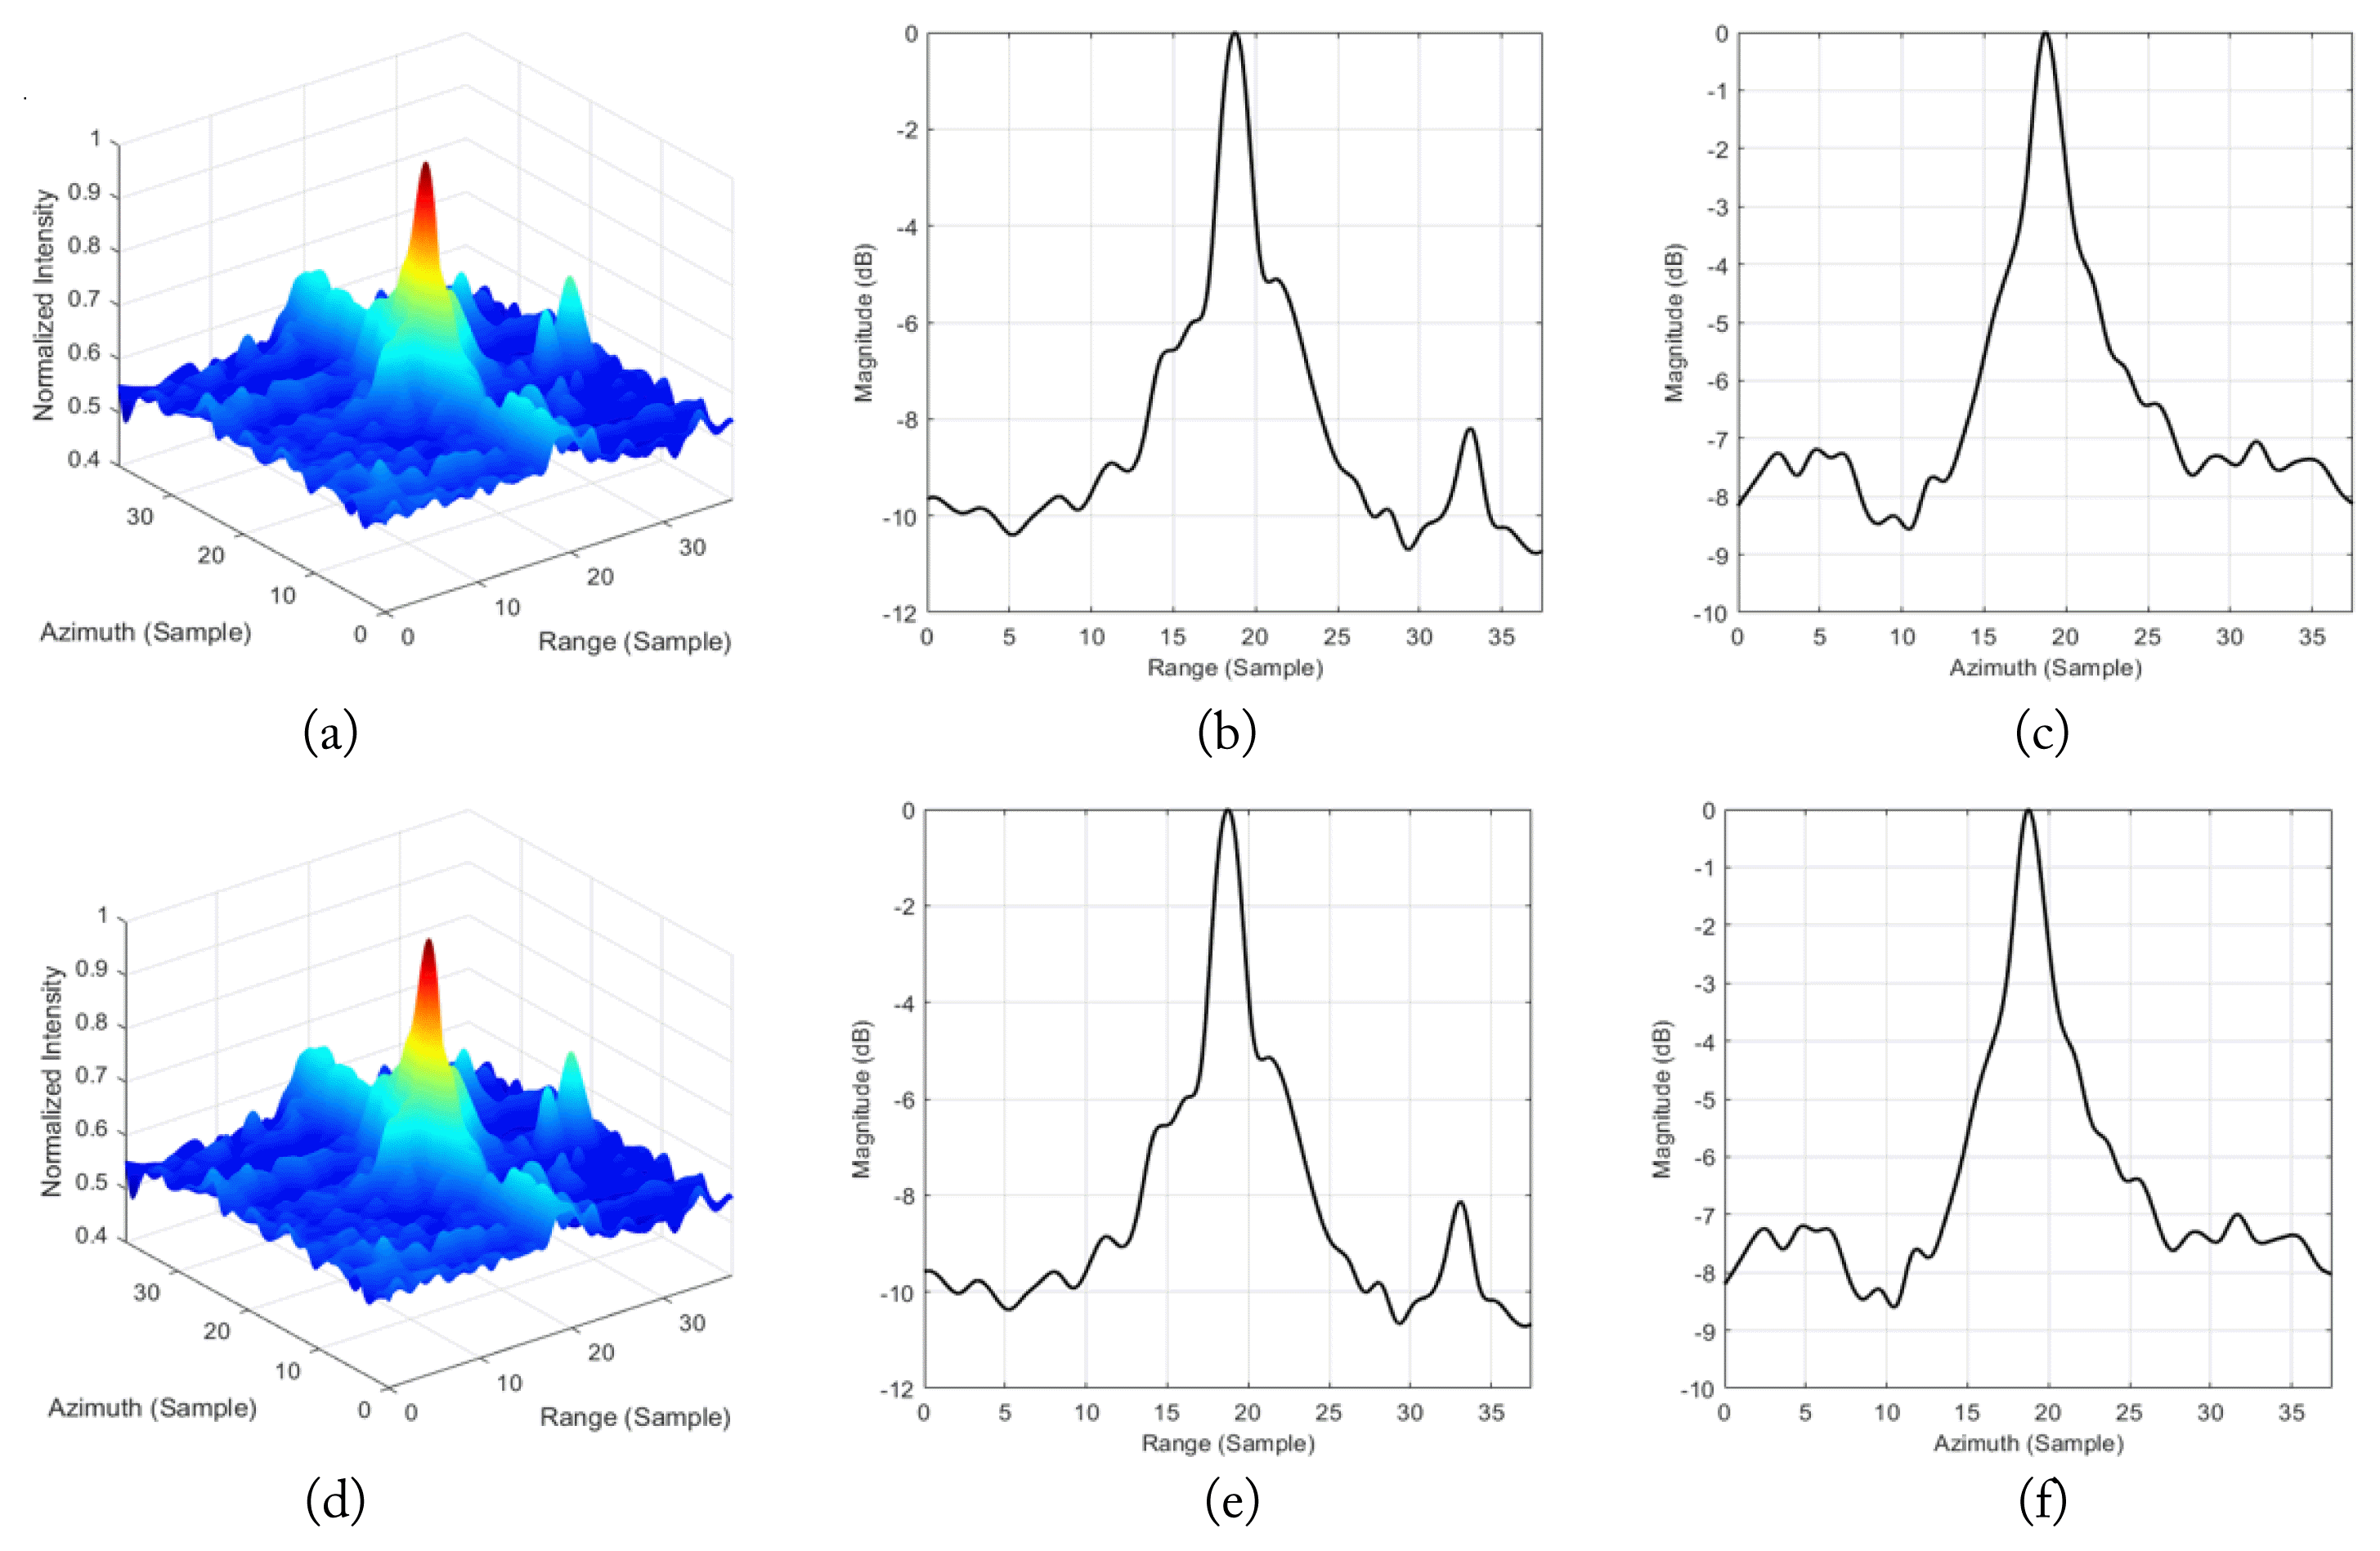
Moreover, an impulse response function (IRF) analysis was performed to provide a quantitative basis for the validity of SAG for Ku-band FMCW SAR. Essential SAR quality parameters, such as impulse response width (IRW) and peak sidelobe ratio (PSLR), were estimated from the IRF [13]. Fig. 8(a) shows a trihedral corner reflector (CR) installed at the field test site for the IRF analysis. Fig. 8(b) shows an aerial photograph of the CR test site. To determine whether SAG degraded SAR image quality, RDA without SAG (Fig. 2(a)) and with SAG (Fig. 2(b)) were performed and compared. Fig. 9(a) and (b) shows the results of the FMCW SAR images for each case. The CR clearly emerged inside the red circles shown in the images. The IRF of the CR in Fig. 9(a) is shown in Fig. 10(a–c). For visual clarity, an interpolation by a factor of 16 was implemented. Fig. 10(a) shows a normalized intensity of the IRF in 3D, and Fig. 10(b) and (c) shows one-dimensional profiles of the IRF in the range and azimuth direction, respectively. Likewise, the IRF of the CR in Fig. 9(b) is shown in Fig. 10(d–f). The peak of the signal was well represented in both the range and azimuth directions. The SAR quality parameters and processing times of RDA with and without SAG are summarized in Table 2. As shown in Fig. 10 and Table 2, applying SAG did not affect the IRW or PSLR values. This provides clear quantitative evidence that our specific Ku-band FMCW SAR can work with SAG. Furthermore, the processing time was significantly reduced (by about 36%) when SAG was applied. This suggests that SAG shortened the processing time without SAR quality parameter performance loss.
A major contribution of this study is its analytical and experimental approaches to determining the feasibility of SAG for FMCW SAR signal processing, which has been contested. No previous studies have verified the validity of SAG using practical raw data. Therefore, in this study, the conditions for applying SAG to FMCW SAR were analyzed and experimentally verified for Ku-band FMCW SAR. The results show that if SAG is applicable, the processing time is reduced without compromising the SAR image quality. Since the platform velocity used was at the aircraft level, the results may be generalizable to automobile applications as well. Moreover, since the operating frequency used in the experiment was in the Ku-band (14.25 GHz), SAG can also be applied to FMCW SAR using operating frequencies below the Ku-band if other parameters are similar. Future studies could investigate whether SAG is applicable to FMCW SAR using frequencies above the Ku-band, such as the K- or the Ka-band.
Acknowledgments
This work was supported by Institute of Information & Communications Technology Planning & Evaluation (IITP) grant funded by the Korea government (MSIT) (No.2018-0-01658, Key Technologies Development for Next Generation Satellites).
Fig. 5
Expected range migrations (black dots) and range resolution (dashed red line) for given specifications.
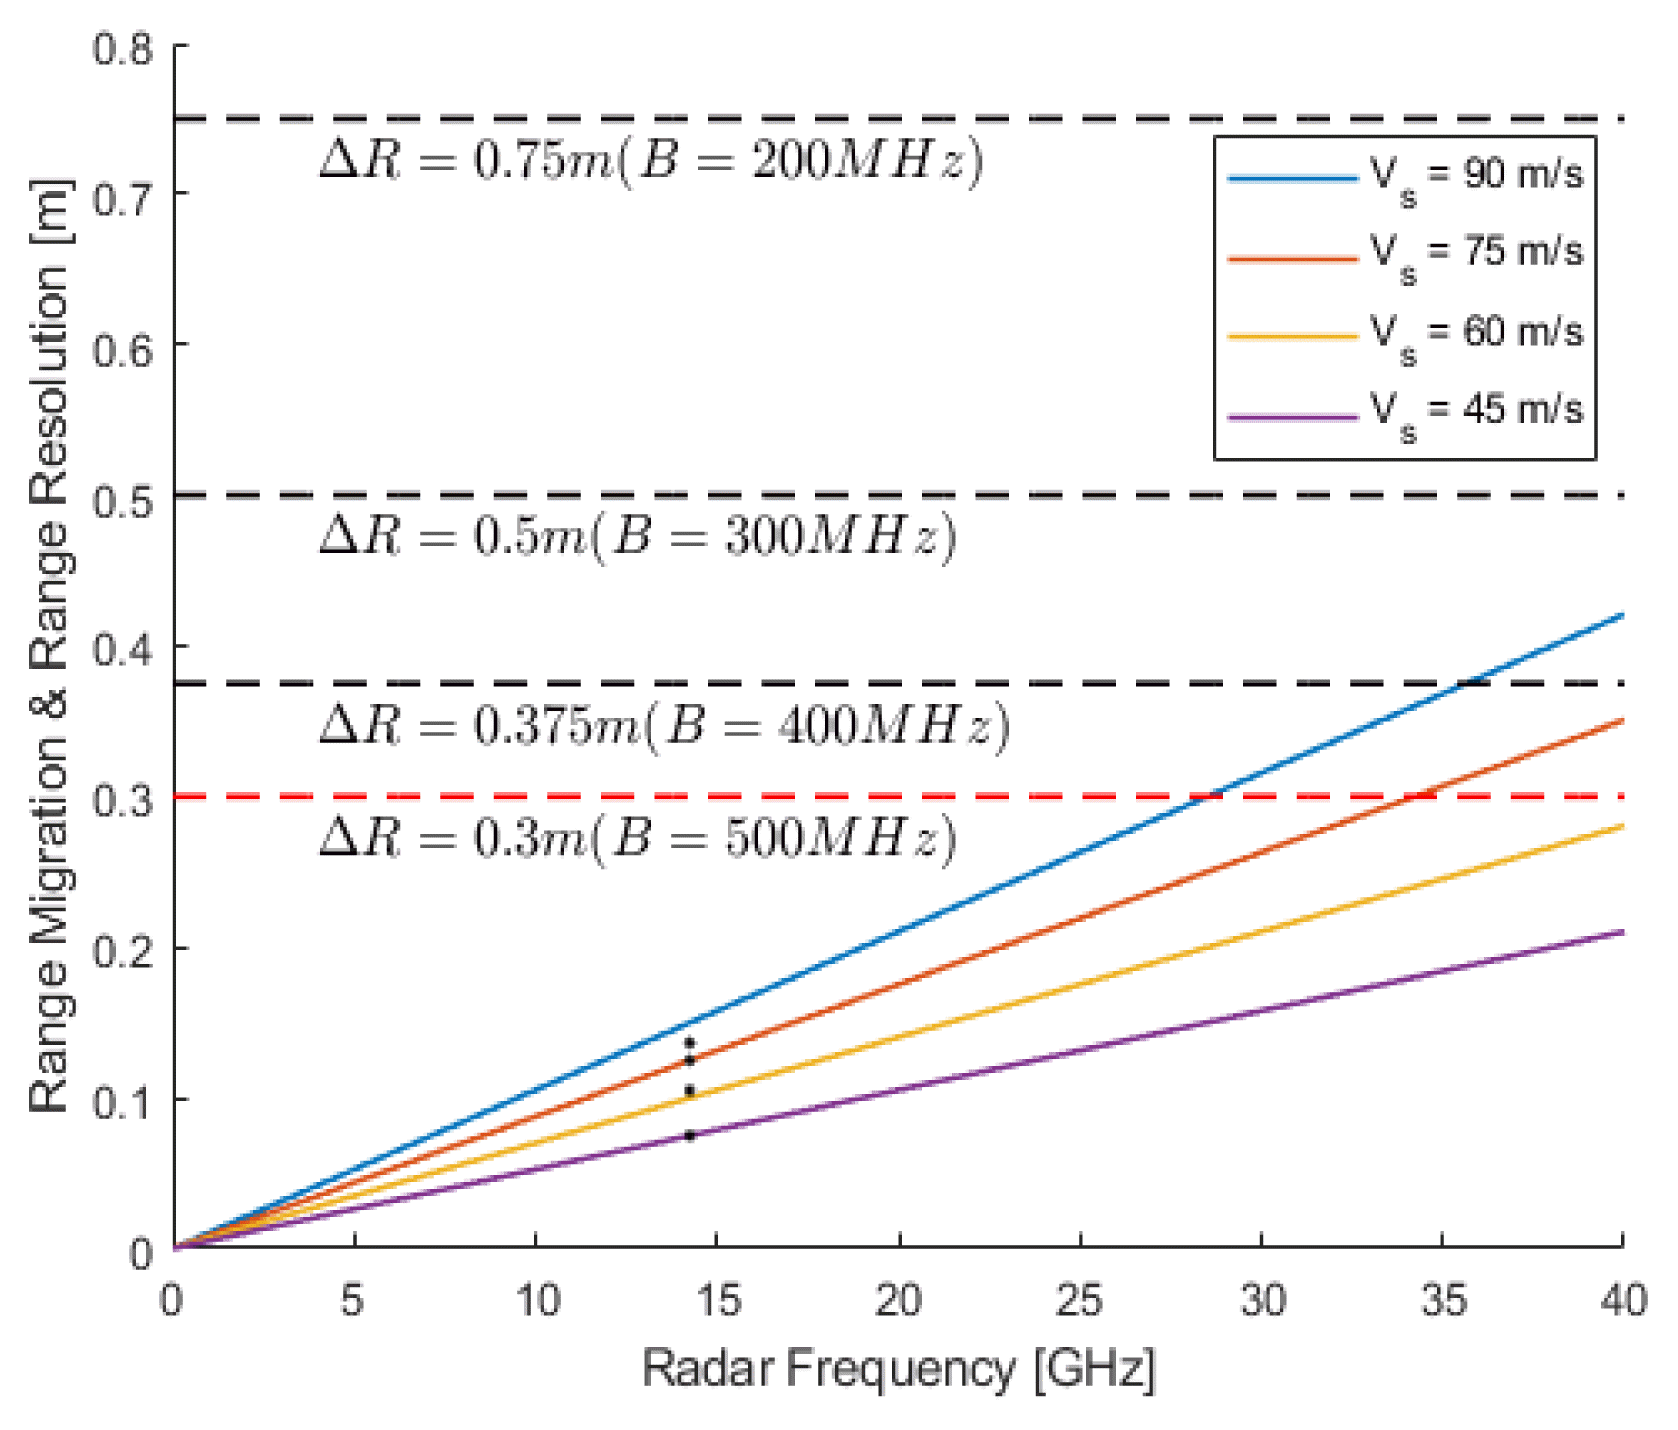
Fig. 7
Aerial photographs of Ku-band FMCW SAR test areas: (a) 75 m/s, (b) 75 m/s, (c) 45 m/s, and (d) 82 m/s.
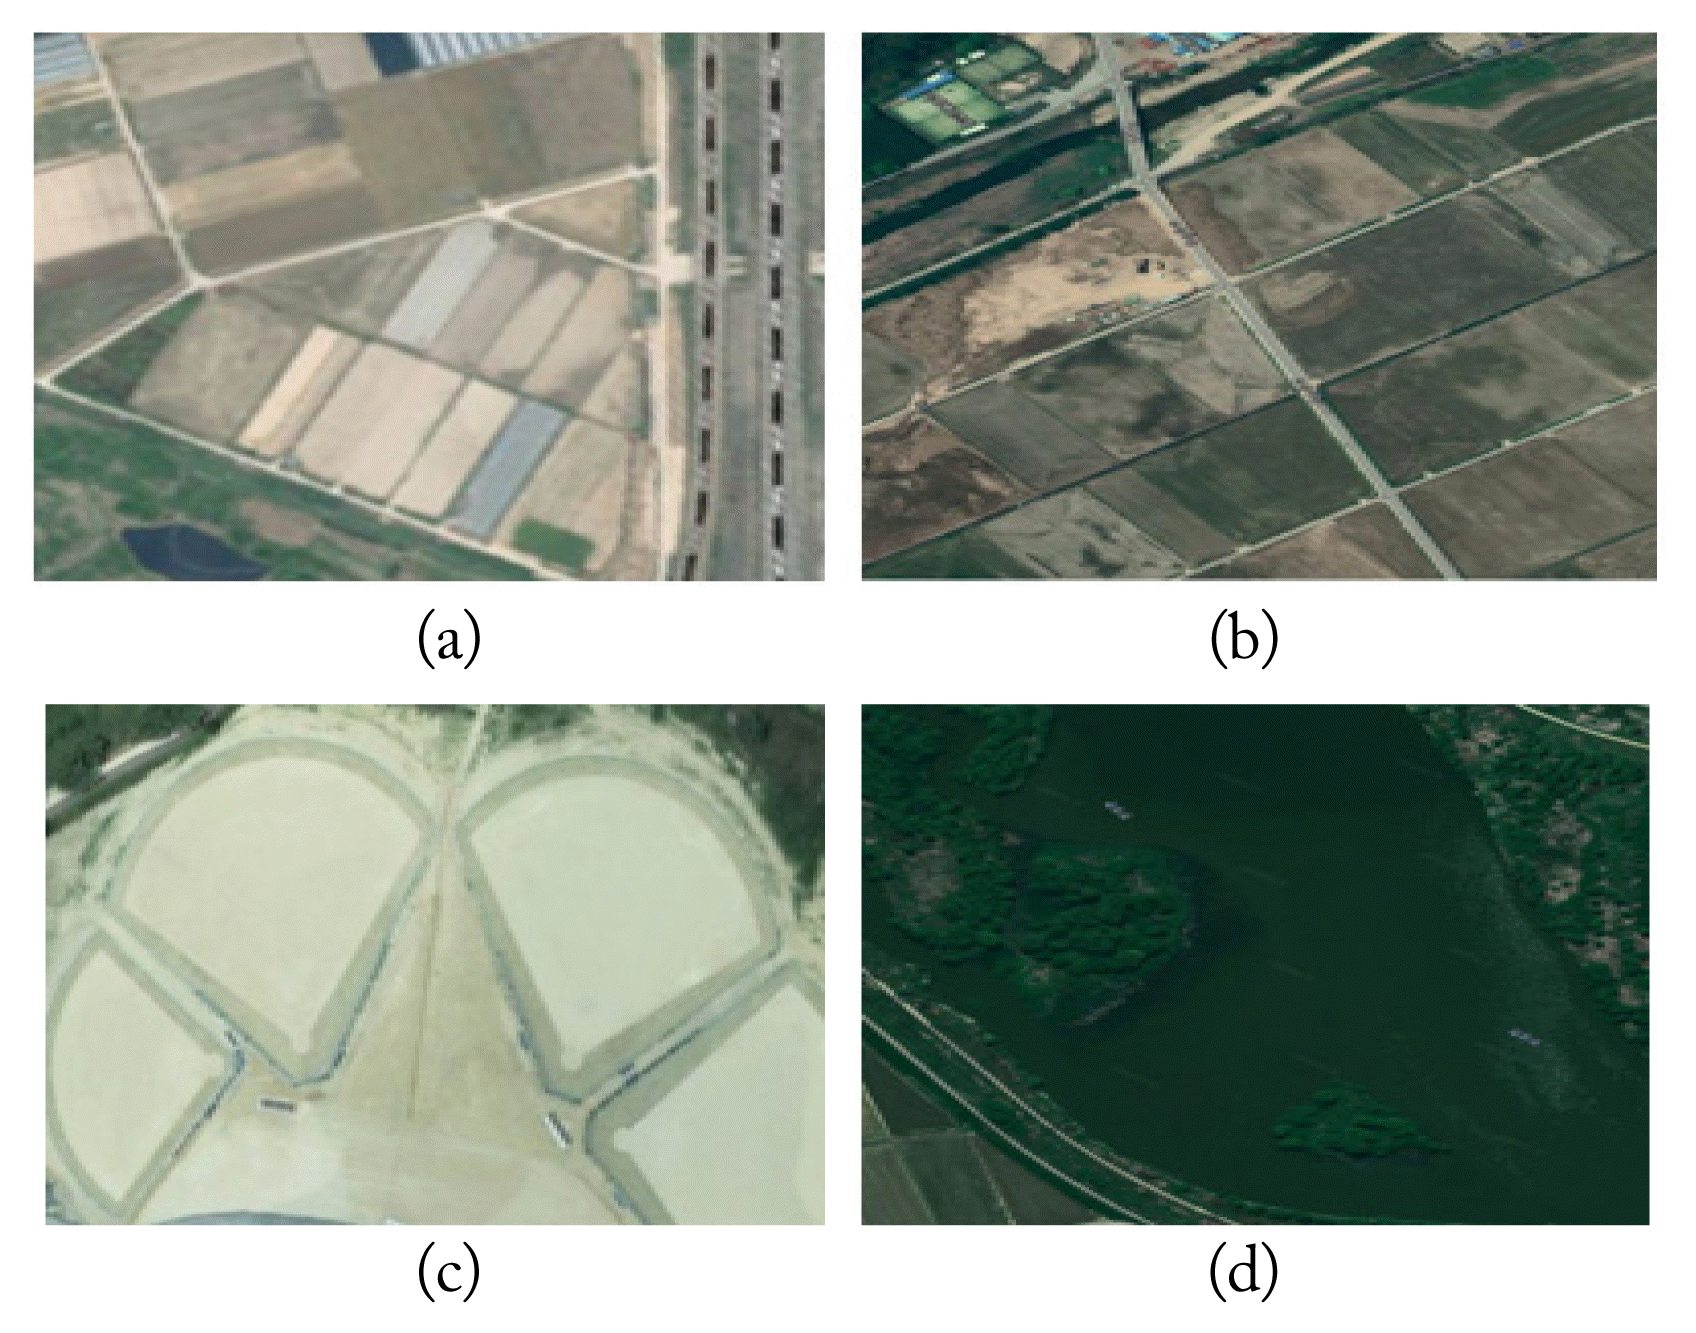
Fig. 8
(a) A trihedral CR, (b) An aerial photograph of the field test site. The CR is installed inside the red circle.
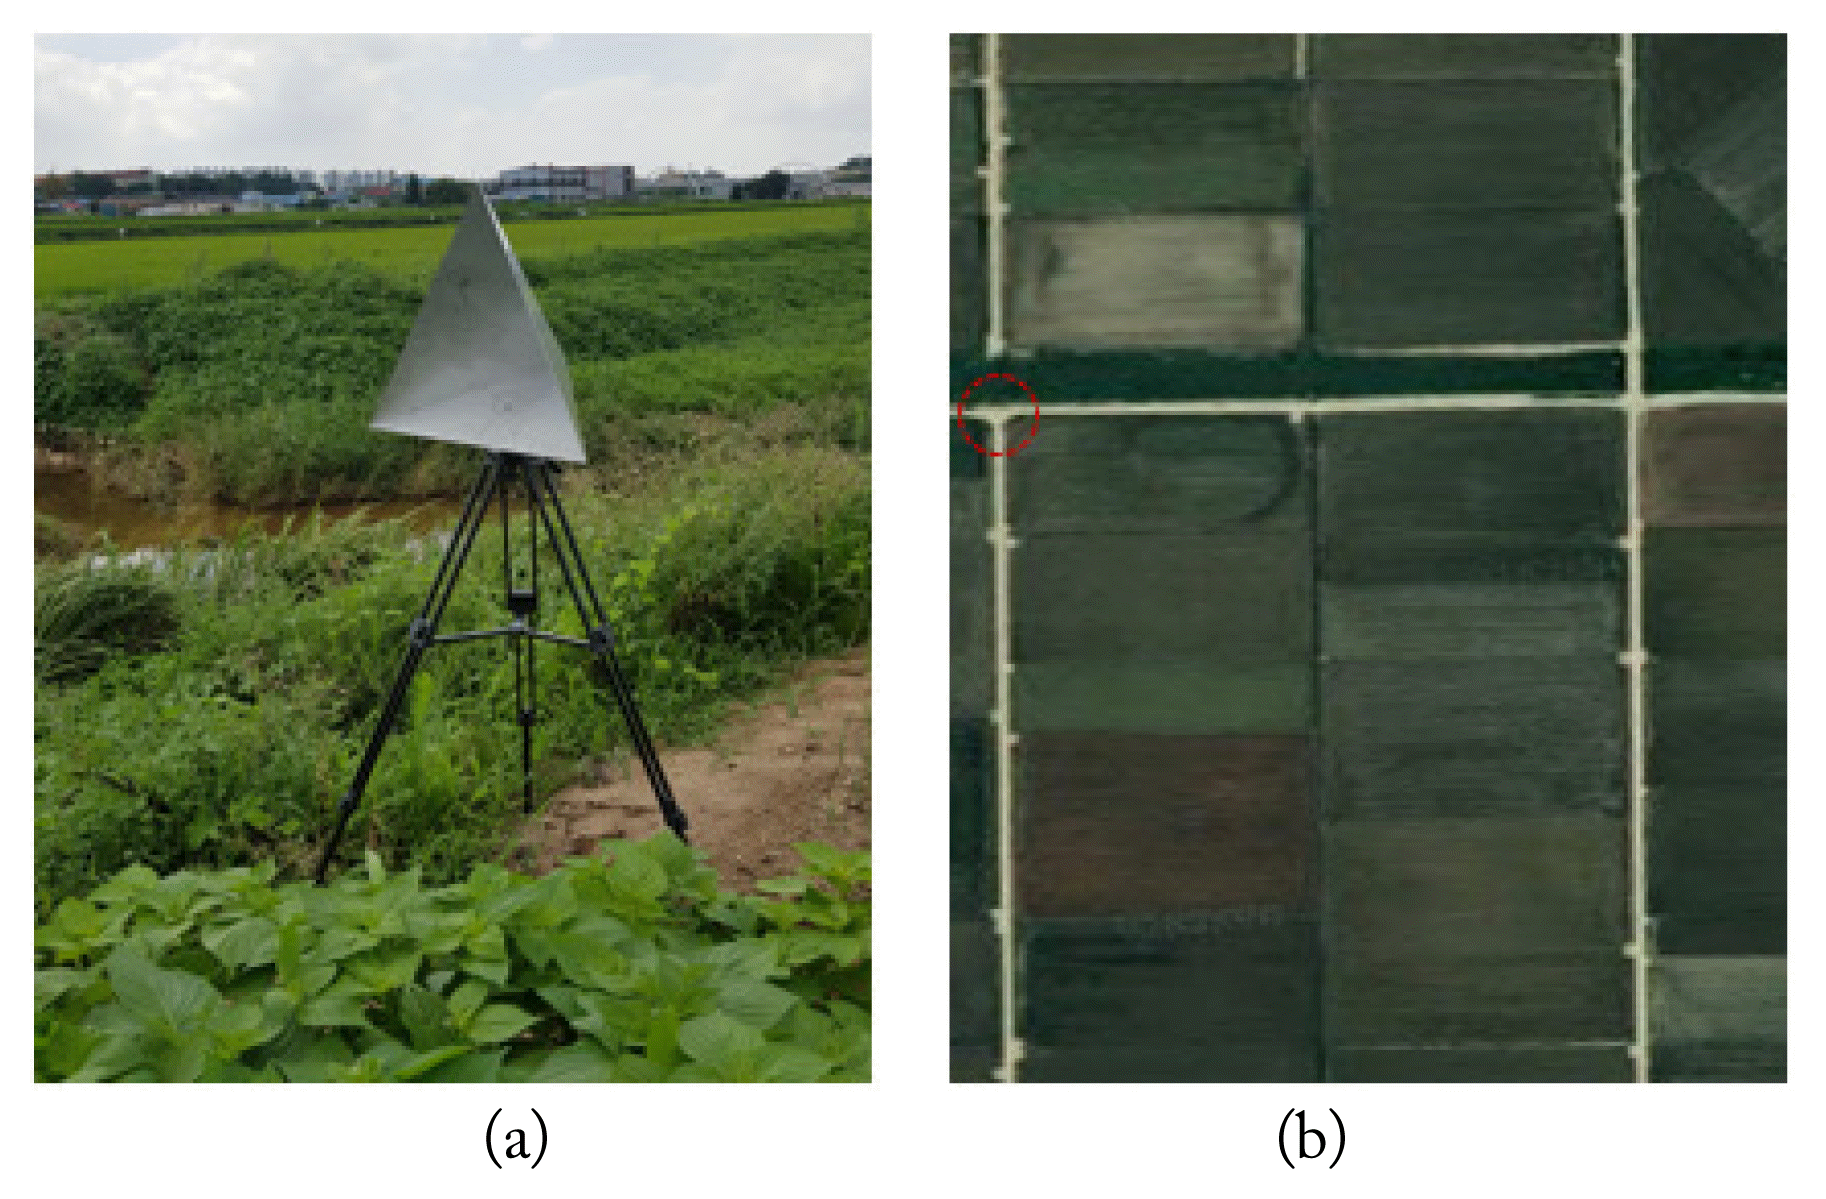
Fig. 10
The IRF of the CR: (a) 3D IRF (RDA without SAG), (b) range profile (RDA without SAG), (c) azimuth profile (RDA without SAG), (d) 3D IRF (SAG-applied RDA), (e) range profile (SAG-applied RDA), and (f) azimuth profile (SAG-applied RDA).
References
1. A Meta, P Hoogeboom, and LP Ligthart, "Signal processing for FMCW SAR," IEEE Transactions on Geoscience and Remote Sensing, vol. 45, no. 11, pp. 3519–3532, 2007.

2. G Shu-min, C Zhu, and H Kan, "Study on Imaging Algorithm of De-chirped FM-CW SAR," In: 2006 CIE International Conference on Radar; Shanghai. pp 1–4, 2006.

3. A Meta and P Hoogeboom, "High resolution airborne FM-CW SAR: Digital Signal Processing Aspects," In: 2003 IEEE International Geoscience and Remote Sensing Symposium; Toulouse. vol. 6, pp 4074–4076, 2003.

4. D-H Jung and S-O Park, "Ku-band car-borne FMCW Stripmap synthetic aperture radar," In: 2017 International Symposium on Antennas and Propagation; Phuket. pp 1–2, 2017.

5. JJM de Wit, A Meta, and P Hoogeboom, "Modified range-Doppler processing for FM-CW synthetic aperture radar," IEEE Geoscience and Remote Sensing Letters, vol. 3, no. 1, pp. 83–87, 2006.

6. B Wang, Z Hu, W Guan, Q Liu, and J Guo, "Study on the echo signal model and R-D imaging algorithm for FMCW SAR," In: IET International Radar Conference 2015; Hangzhou. pp 1–6, 2015.
7. H Bi, J Zhang, P Wang, and G Bi, "Airborne FMCW SAR Sparse Data Processing via Frequency-Scaling Algorithm," IEEE Geoscience and Remote Sensing Letters, vol. 18, no. 7, pp. 1224–1228, 2021.

8. E Casalini, M Frioud, D Small, and D Henke, "Refocusing FMCW SAR Moving Target Data in the Wavenumber Domain," IEEE Transaction on Geoscience and Remote Sensing, vol. 57, no. 6, pp. 3436–3449, 2019.

9. D-H Jung, H-S Kang, C-K Kim, J-H Park, and S-O Park, "Sparse Scene Recovery for High-Resolution Automobile FMCW SAR via Scaled Compressed Sensing," IEEE Transactions on Geoscience and Remote Sensing, vol. 57, no. 12, pp. 10136–10146, 2019.

10. H Bi, J Wang, and G Bi, "Wavenumber Domain Algorithm-Based FMCW SAR Sparse Imaging," IEEE Transactions on Geoscience and Remote Sensing, vol. 57, no. 10, pp. 7466–7475, 2019.

11. Y Liu, YK Deng, and R Wang, "Focus Squint FMCW SAR Data Using Inverse Chirp-Z Transform Based on an Analytical Point Target Reference Spectrum," IEEE Geoscience and Remote Sensing Letters, vol. 9, no. 5, pp. 866–870, 2012.

12. D-H Jung, D-H Kim, MT Azim, J-H Park, and S-O Park, "A Novel Signal Processing Technique for Ku-Band Automobile FMCW Fully Polarimetric SAR system Using Triangular LFM," IEEE Transactions on Instrumentation and Measurement, vol. 70, pp. 1–10, 2021.


13. IG Cumming and FH Wong, Digital Processing of Synthetic Aperture Radar Data. London: Artech House Inc, 2005.
Biography

Young-Geun Kang was born in Daejeon, South Korea, in February 1994. He received a B.S. degree in electrical and electronic engineering from Yonsei University, Seoul, South Korea, in 2018, and an M.S. degree in electrical engineering from KAIST, Daejeon, in 2020. He is currently pursuing a Ph.D. in electrical engineering at the Korea Advanced Institute of Science and Technology. His current research interests include synthetic aperture radar (SAR), SAR signal processing, and satellite technology.
Biography

Dae-Hwan Jung was born in Seoul, South Korea, in 1988. He received a B.S. degree in electronic and electrical engineering from Sungkyunkwan University, Suwon, South Korea, in 2014 and M.S. and Ph.D. degrees in electrical engineering from the Korea Advanced Institute of Science and Technology, Daejeon, South Korea, in 2016 and 2020, respectively. He joined Samsung Electronics, Seoul, South Korea, in 2020. His current research interests include image processing, sensor modules design, frequency-modulated continuous-wave synthetic aperture radar (SAR), and SAR signal processing.
Biography
Goo-Hwan Shin was born in Kyung-Nam, South Korea, in January 1966.Since July 2000, he has been with the Satellite Technology Research Center where he is currently a principal research engineer. His research interests include mobile communication systems, synthetic aperture radar antennas, and communications satellite constellation systems. Dr. Shin was included in Marquis Who’s Who biographical dictionary in 2008.
Biography
Chul-Ki Kim was born in Gangneung, South Korea, in July 1989. He obtained a B.S. degree in electronic engineering from Soongsil University, Seoul, South Korea, in 2014 and M.S. and Ph.D. degrees in electrical engineering from the Korea Advanced Institute of Science and Technology (KAIST), Daejeon, South Korea, in 2016 and 2021, respectively. He is currently a post-doctorate, electrical engineering researcher at KAIST. His current research interests include synthetic aperture radar and radar system engineering.
Biography

Seong-Ook Park was born in KyungPook, South Korea, in December 1964. He obtained a B.S. degree from KyungPook National University, South Korea, in 1987, an M.S. degree from the Korea Advanced Institute of Science and Technology (KAIST), Daejeon, South Korea, in 1989, and a Ph.D. degree from Arizona State University, Tempe, AZ, USA, in 1997, all in electrical engineering. From March 1989 to August 1993, he served as a research engineer at Korea Telecom, Daejeon, working on microwave systems and networks. He later joined the Telecommunication Research Center at Arizona State University, where he remained until September 1997. Since October 1997, he has been with the Information and Communications University, Daejeon, and is currently a Professor at KAIST. His research interests include mobile handset antennas, radar systems, and analytical and numerical techniques in the field of electromagnetics. Dr. Park is a member of Phi Kappa Phi.
- TOOLS
- Related articles in JEES


