J. Electromagn. Eng. Sci Search

CLOSE


J. Electromagn. Eng. Sci > Volume 23(4); 2023 > Article
Gao and Xu: Reduction of Electric Vehicle Electromagnetic Radiations Using a Global Network Model

Abstract

To address an electric vehicle’s magnetic emission problem, a model-based improvement strategy is proposed to avoid resource-intensive experimental diagnosis processes, thus achieving higher efficiency. Considering the electrical and structural characteristics of electric vehicles, a network model is developed to predict magnetic emissions. It decomposes the electronic power system into a global network and external circuit nodes according to electrical size. The Z-parameter is used to characterize the global network for the decomposition of impedance coupling so that the model parameters can be obtained separately using different methods. With this network model, an evaluation index is designed to measure the influence of technical factors on magnetic emissions by comprehensively considering their contributions and rooms for improvement. Engineers can directly determine the main interference source according to this evaluation score, and select a proper filter to attenuate the interference.

I. Introduction

Electrification and intelligence are major technical trends in the vehicle industry because of their contributions to traffic safety, travel convenience, energy conservation, and emission reduction [13]. However, from the point of view of electromagnetic compatibility (EMC), the electromagnetic environment both inside and outside electric vehicles (EVs) deteriorates dramatically because of the increase in potential interferences, sensitive equipment, and coupling paths [4, 5]. To ensure that other equipment operates smoothly and correctly, the electromagnetic interference (EMI) generated by onboard electronic/electrical components is limited by regulations for both components and vehicles, such as SAE J551-5 and CISPR 12 [6]. However, the relevant tests can be conducted only when all components are ready and the vehicle layout has been established. At this stage, considerable financial and human resources may be expended to identify and solve an EMC problem. Numerical simulation is an effective way of designing and analyzing vehicle EMC and can be performed throughout the product development process [79]. For example, improvement measures such as using special wires or filters, changing the vehicle layout, and shielding components can be evaluated by simulation at an early stage [10, 11].
At the component level, many studies have attempted to reduce EV emissions by controlling the EMI generated by power components. For example, Chun et al. proposed suppression methods for a high-power DC/DC converter based on an analysis of the interference transmission path [12]. In another study, a new active filter for the high-frequency common mode (CM) currents of the motor driver was designed to reduce radiation [13]. Nevertheless, vehicle EMC is associated with not only components but also such factors as the vehicle layout, body structure, and cable routing. Moreover, vehicle EMC problems may exist even if all components satisfy EMC requirements. Thus, it is necessary to model and simulate vehicle EMC from an early development stage. However, the effectiveness of a simulation depends greatly on model accuracy. The key to vehicle EMC modeling is to characterize the equivalent interference sources and sensitive equipment and map the propagation paths of the interferences. The modeling process for the numerical prediction of vehicle EMI is even more complicated because of the variety of electrical/electronic components, sophisticated body structures (large electrical structures coexisting with small electrical structures), and diverse radiation and conduction paths [14].
The aforementioned modeling challenges can be addressed in two main ways. One is to use an equivalent circuit to describe the distributed parasitic effect. This is further combined with the equivalent circuit model of interference sources and sensitive equipment to describe the EMC problem. Its advantage is that the mature circuit theory can be used. However, this approach is normally adopted to predict conduction emissions, not radiation, because of the difficulty of abstracting the equivalent circuit to fit high-frequency characteristics [15]. Some numerical methods that solve the three-dimensional (3D) electromagnetic equations, such as the finite element method, can be used to calculate the parasitic parameters [16]. For example, to study the motor’s influence on vehicle radiation, Jeschke et al. considered the motor to be a passive load modeled according to an equivalent circuit [17].
Another vehicle EMC simulation strategy called the transfer function method can be used to calculate both radiation and conduction emissions [18]. The transmission path is described using a transfer function, and its input is the equivalent excitation signal measured from the interference sources. Based on this idea, a four-step EMI evaluation procedure was presented to predict vehicle-level radiation in [19]. The application of this strategy was further extended to the immunity analysis of an electronic module in [20]. To reduce the complexity of EMC modeling, Funato et al. developed a vehicle-level analysis technology by splitting the model into three parts [21]. This approach assumes that the interference is the current propagating along the wirings, which also act as a radiation antenna. Consequently, vehicle EMC can be predicted if the interference currents are known. The disadvantage is that the transfer function varies with the port impedance. Thus, to obtain a correct transfer function, all relevant parts must be interconnected.
Although many efforts have been made to model and predict vehicle EMI, for such complex systems as EVs, the key coupling paths, interference sources, and sensitive equipment— let alone the possible solutions—are difficult to determine directly. Moreover, vehicle radiation is a system problem. Reducing the source interference, weakening the transfer path, and enhancing the vehicle’s anti-interference ability are all beneficial to EMC. However, determining the main technical factor to be systematically improved remains challenging [11]. To overcome these difficulties, this study uses multi-port network theory to model the low-frequency magnetic emissions of an EV. To reduce modeling complexity, the system is decomposed into separate parts according to electrical size and shielding level. The transmission path of interference is described by the Z-parameter to eliminate the coupling effect of impedance. Based on this network model, an evaluation index is designed to measure the importance of technical factors using the entropy weight method (EWM) according to the contribution and sensitivity analysis results. Radiation is successfully attenuated to the required level by adding a filter to the component with the highest evaluation index.
The rest of this paper is organized as follows: The vehicle magnetic radiation problem is introduced in Section II. The network model developed to predict an EV’s magnetic emissions considering its electrical and structural characteristics is presented in Section III. The evaluation index designed to determine the main interference source and tackle the emission problem based on the network model is detailed in Section IV. Section V concludes the paper.

II. Problem Description

The studied EV is a four-seat sedan, whose low-frequency radiation is measured according to SAE J551-5 [22]. The test system layout is shown in Fig. 1(a). The magnetic field on the left side with x polarization exceeds the limit by 10 dBμA/m at about 15 MHz, as shown in Fig. 1 (b). The excess magnetic field is broadband and is always generated by turning the inductive modules on and off.
Since the vehicle layout is fixed, it is almost impossible to change the component arrangement or the electrical system. A feasible way is to identify and improve the main magnetic interference source. A traditional method of identifying the interference source is to compare the emissions in different combinational running states by switching different components on and off. However, this is resource-intensive and cannot provide an efficient improvement scheme.
To identify the main interference source without combinational tests, and thus more efficiently, a network model is developed to predict the magnetic field in a frequency range of 150 KHz–30 MHz (see Section III), and then an index is designed to calculate the importance of each factor using the network model (see Section IV). Factors with greater contributions to emissions have higher values. Using this evaluation index, engineers can more easily determine the preferred component to be improved.

III. Modeling The Vehicle’s Magnetic emissions

Normally, low-frequency radiation is generated by an EV’s high-voltage system. Therefore, before modeling its magnetic emissions, the vehicle’s high-voltage system is analyzed to identify what to model and how.

1. Analysis of the Vehicle’s High-Voltage System

The high-voltage system of an EV is shown in Fig. 2. When modeling a vehicle’s low-frequency radiation, the following should be considered:
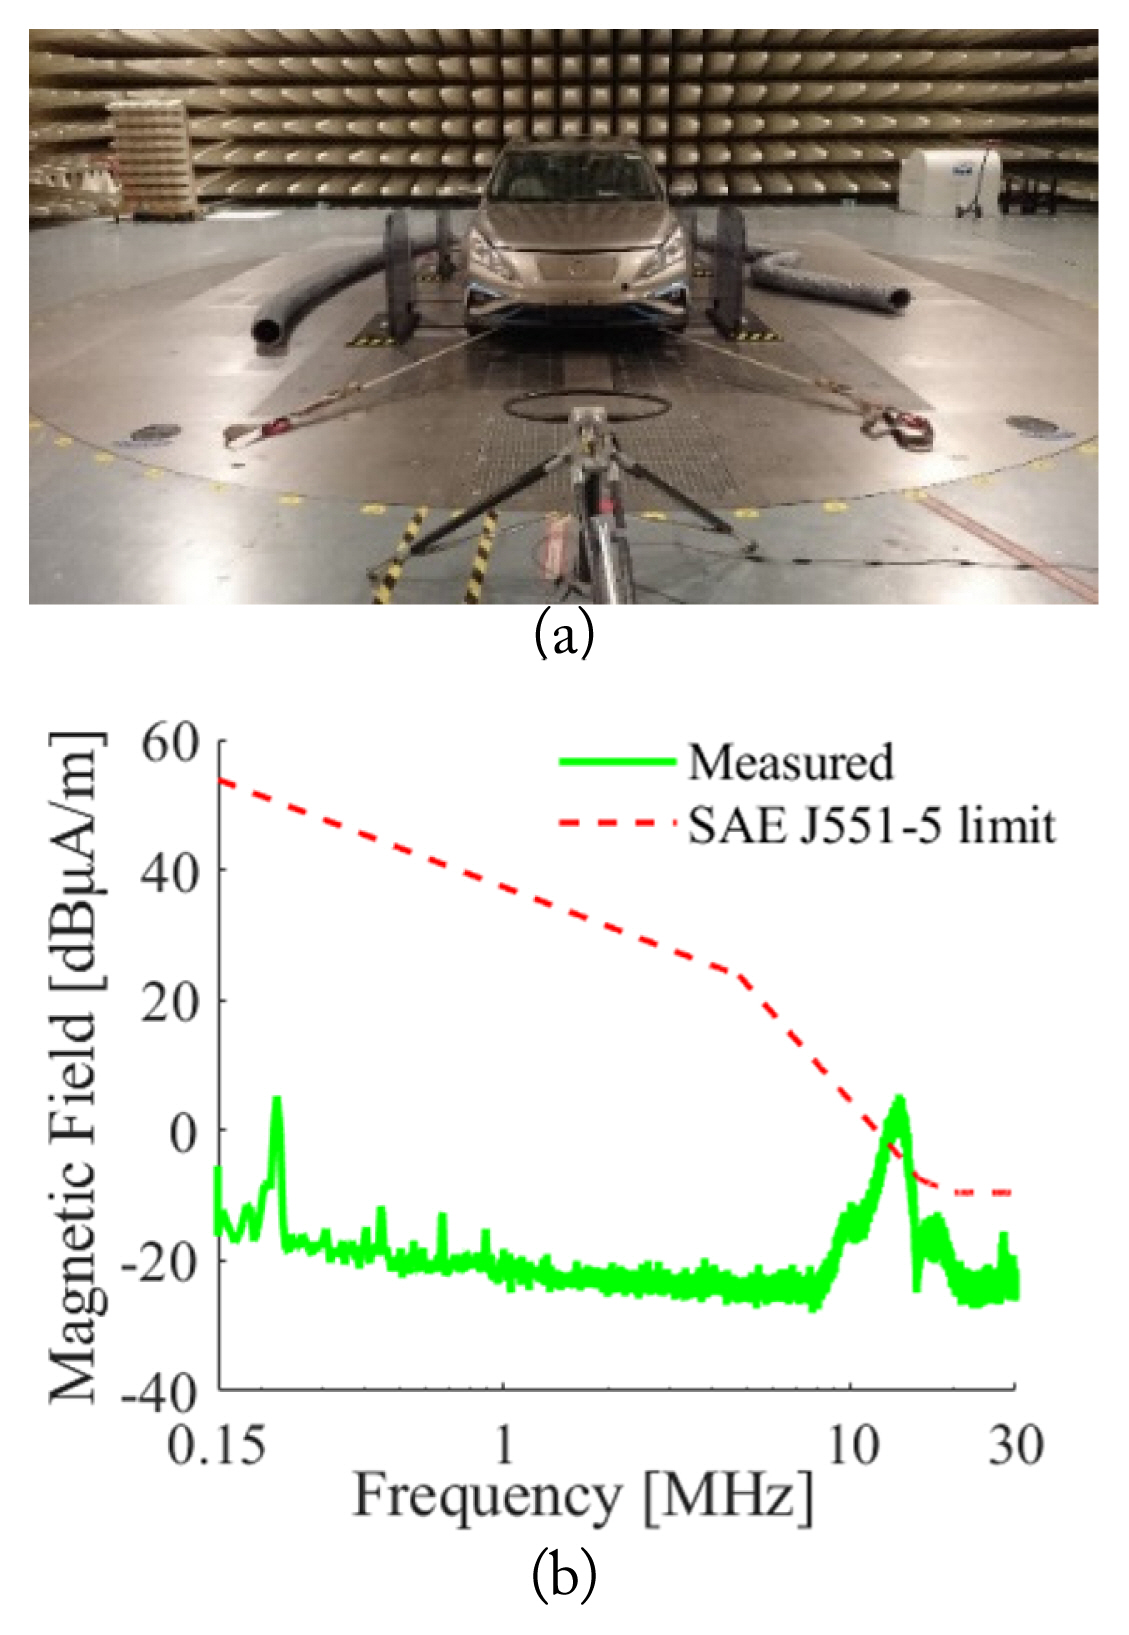
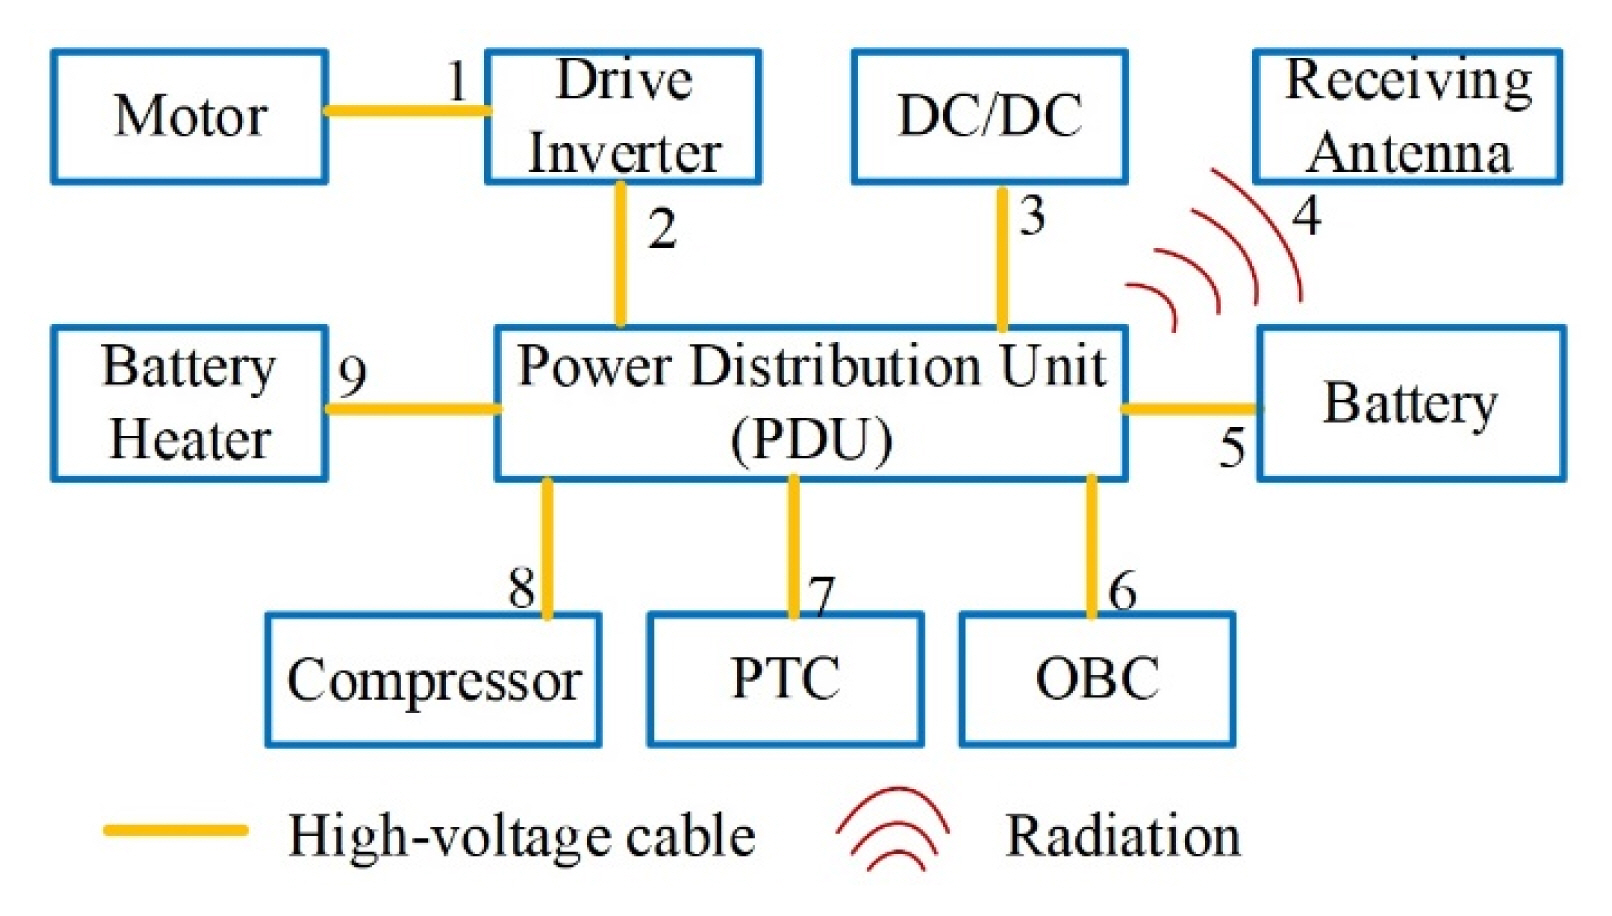
  1. Under the test conditions required by SAE J551-5, components such as the PTC, OBC, and compressor are inactive so that radiation is caused only by DC/DC and the traction system due to their internal electronic power devices with high-frequency switching.

  2. Since the positive and negative high-voltage cables are routed parallel and close to each other with fine shielding, the vehicle’s emissions are mainly generated by CM interference.

  3. Most interferences are radiated by the high-voltage cables because [23, 24] (1) the power components are packed in metal shells with fine shielding and (2) their size is much smaller than the wavelength of the EMI in question and the length of the high-voltage cables.

2. Equivalent Multi-port Network Model

Limited by computational capacity, predictions by solving Maxwell equations in 3D space are suitable only for problems caused by just one or two main components. On the other hand, the equivalent circuit and transfer function methods have critical restrictions in terms of obtaining model parameters, applicable frequency ranges, prior information about the problem. Thus, multi-port network theory is used to describe the complicated couplings among components, wirings and metal structures, considering the following facts [8, 9][25]:
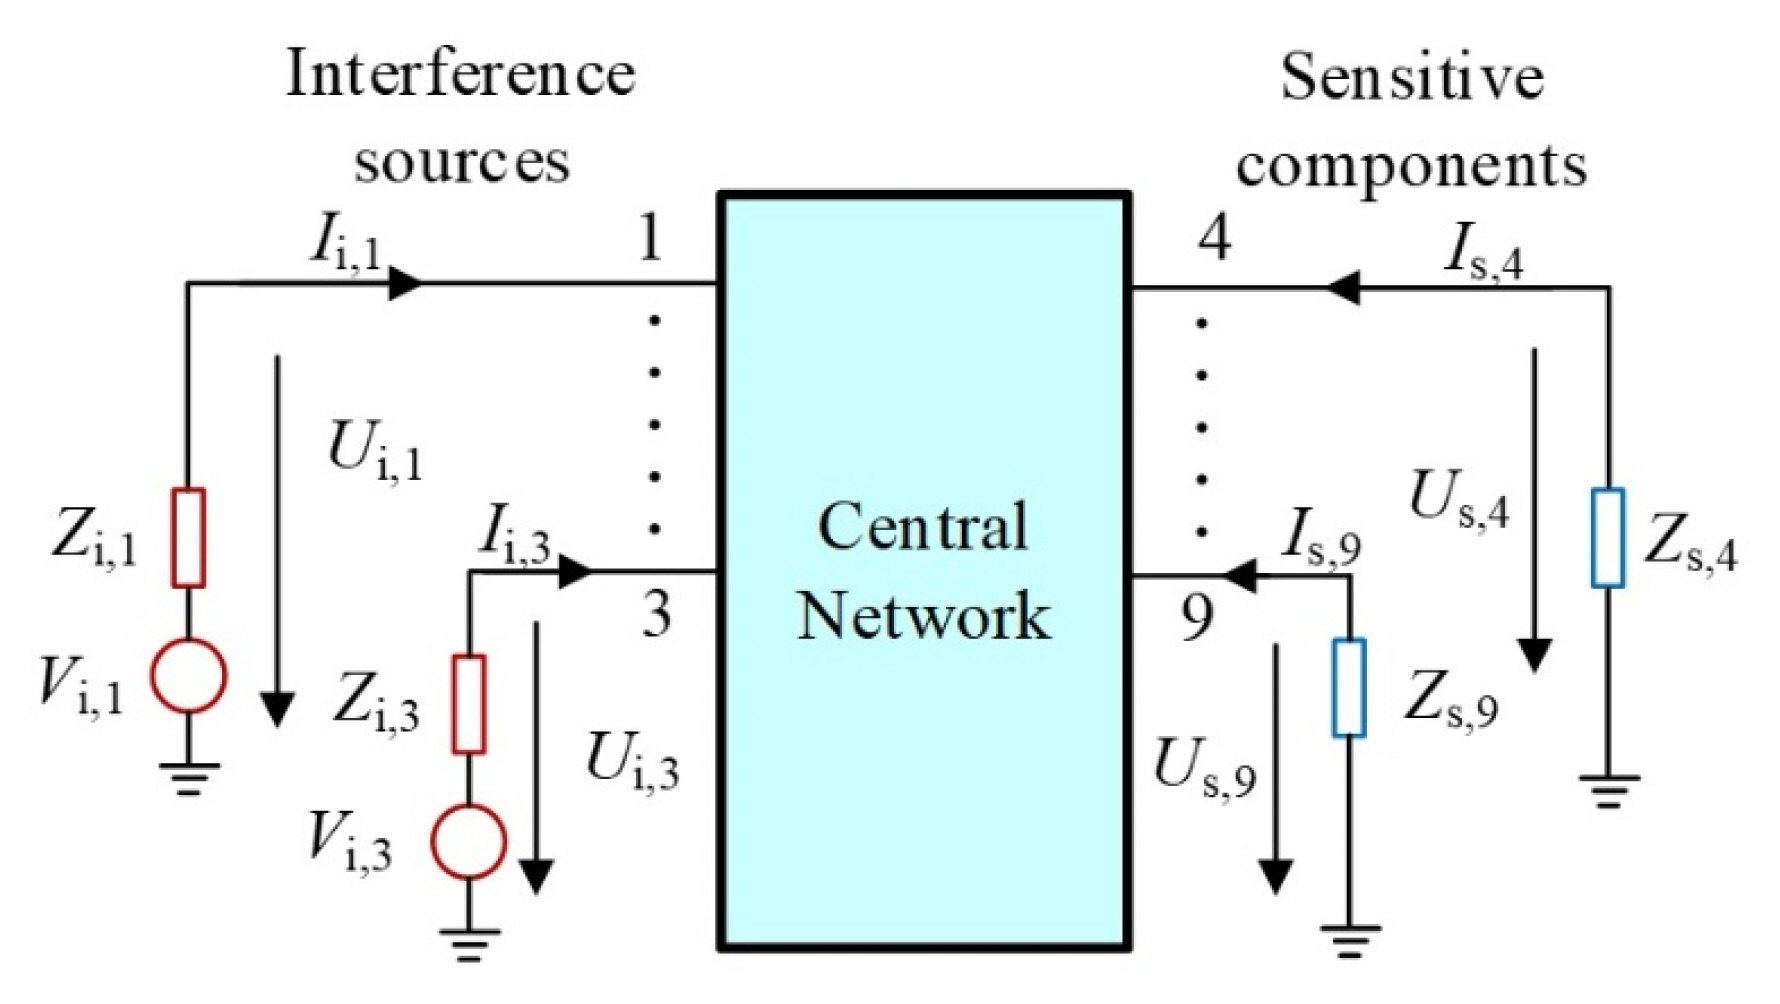
  1. As discussed in Section 1, magnetic energy is mainly radiated from the high-voltage cables, which are a linear component, so the couplings among different parts can be described by a network model.

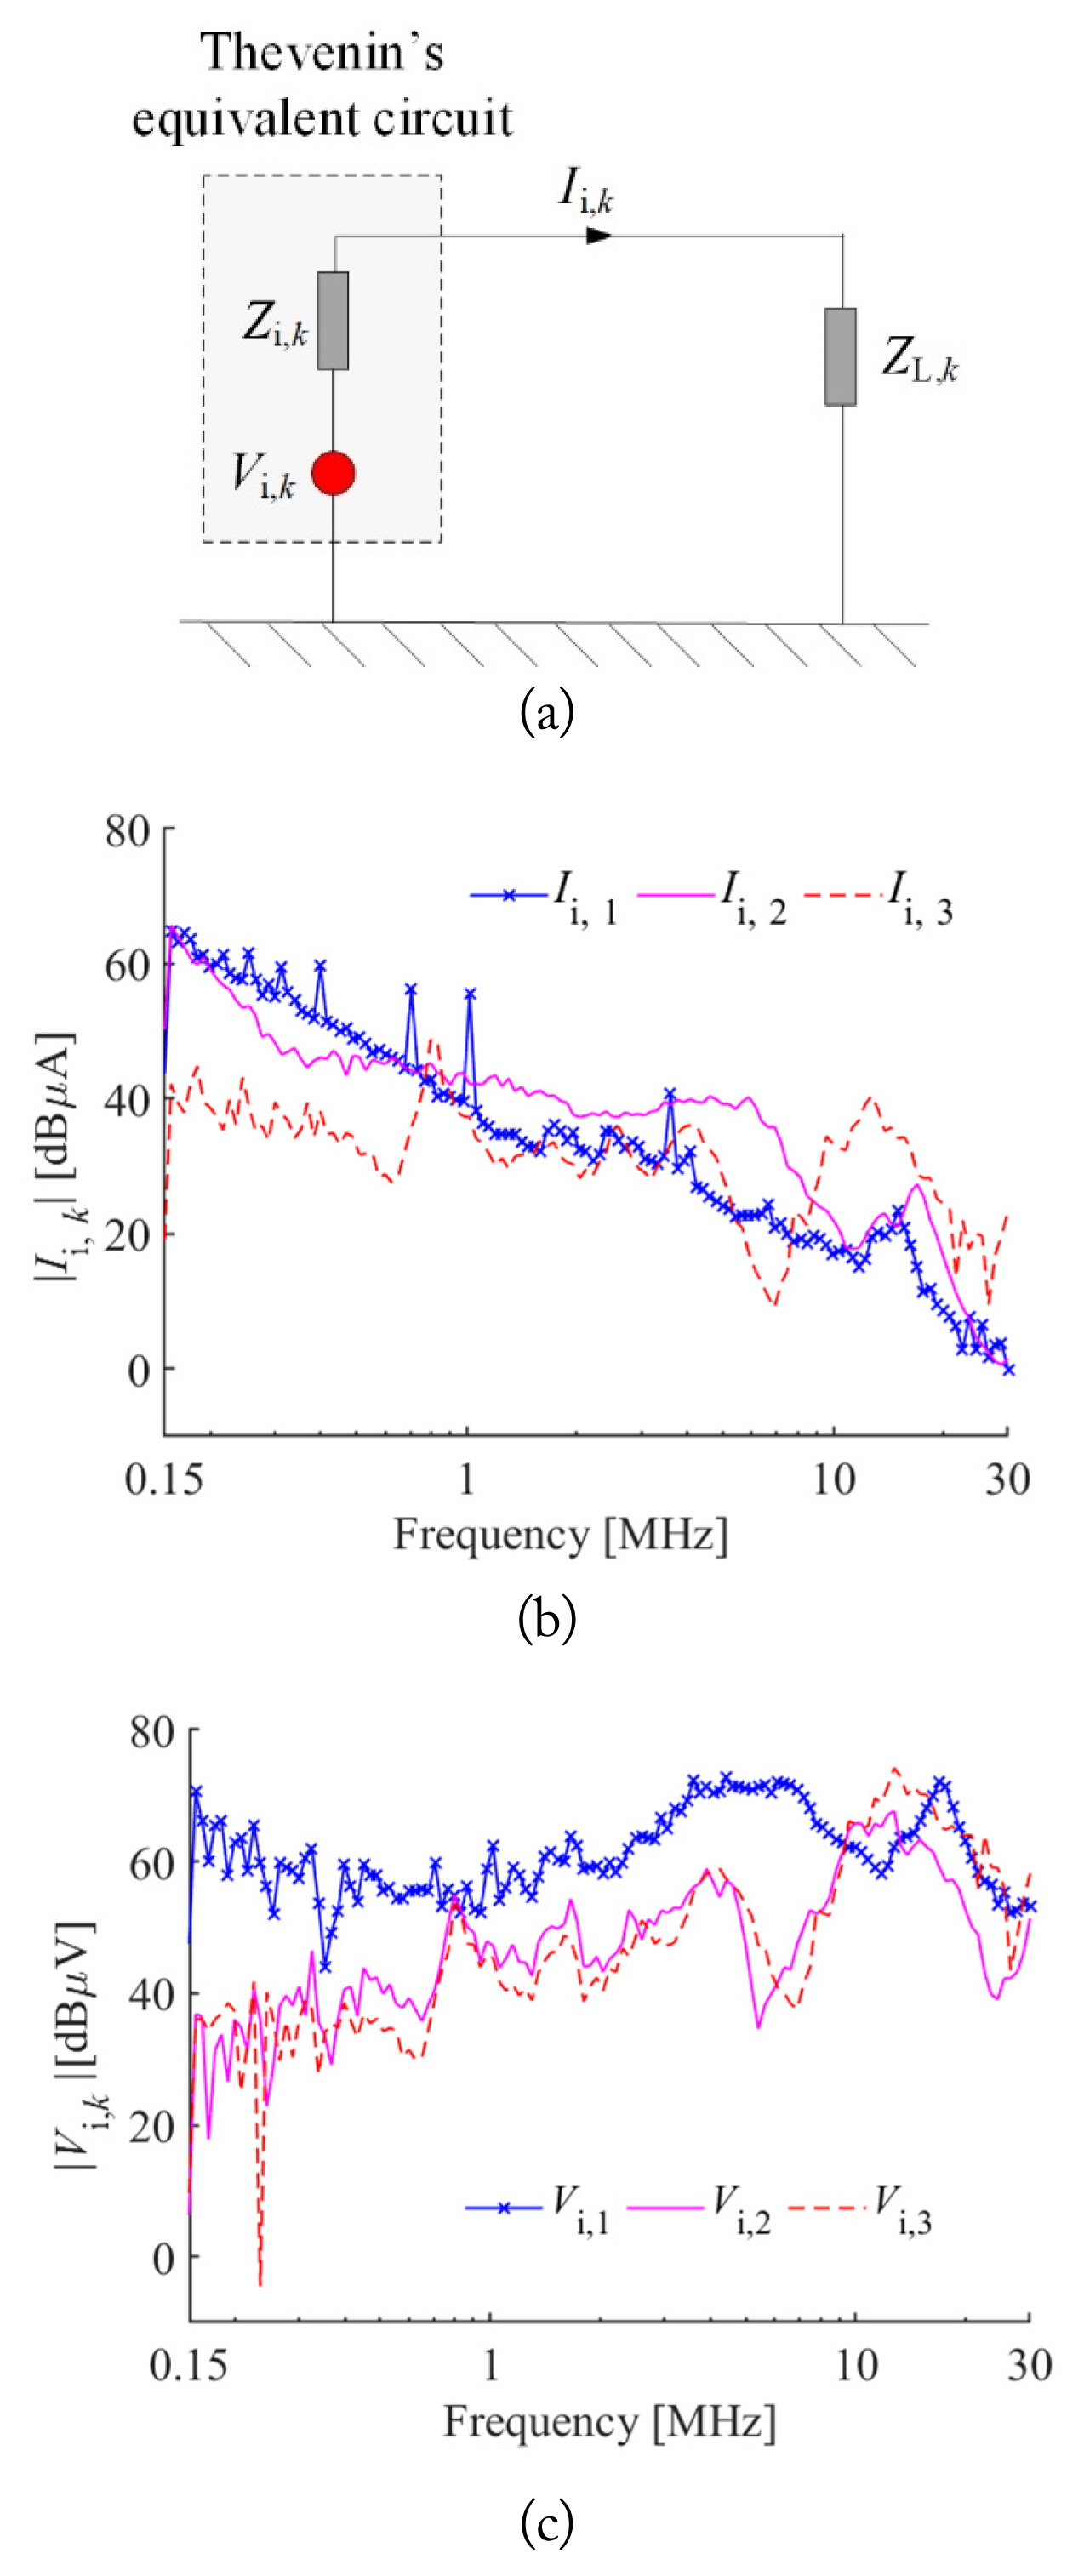
  2. The nonlinear parts of the power components are packed in metal shells, and their size is comparatively small, so they can be characterized by equivalent voltage/current sources with internal impedances.

  3. The Z-parameter of the network is independent of the impedance of the parts connected to the network [8], so the model parameters of the network and components can be obtained separately using different methods.

To predict the vehicle’s magnetic emissions, the equivalent multi-port network model is set up as shown in Fig. 3, in which the port number is the same as in Fig. 2. The radiation process and couplings among different parts are described by the central network. The power components with switching circuits are considered to be the interference sources and modeled by Thevenin’s equivalent circuits [26], whose equivalent voltage and internal impedance are Vi,k and Zi,k, k=1, ···, 3, respectively. Other components, including the receiving antenna, are regarded as the sensitive components and characterized by equivalent impedances Zs,k, k=4, ···, 9.
According to circuit theory, the port voltages Ui,i and Us,i satisfy
(1)
Ui,k=Vi,k-Zi,kIi,k,         k=1,,3,Us,k=-Zs,kIs,k,         k=4,,9,
where Ii,i, and Is,i are the port currents for the interference sources and sensitive components, respectively.
According to multi-port network theory, on the other hand, the port voltages and currents of the central network satisfy [8]
(2)
U=ZNI,U=[Ui,1Ui,2Ui,3Us,4Us,9]T,I=[Ii,1Ii,2Ii,3Is,4Is,9]T,
where ZN is the Z-parameter of the central network. Combining (1) and (2),we have
(3)
I=(ZN+ZC)-1VC,ZC=diag(Zi,1,Zi,2,Zi,3,Zs,4,,Zs,9),VC=[Vi,1Vi,2Vi,300]T.
The interference voltage Us,4, measured by the receiving antenna, is obtained by substituting Eq. (3) with Eq. (2):
(4)
Us,4=ZN(4,:)I,
where ZN(4,:) denotes the fourth row of ZN. The magnetic emission can then be obtained by correcting Us,4 using the antenna’s conversion coefficient.

3. Numerical Calculation of the Network’s Z-parameter

A numerical method is used to calculate the Z-parameter of the central network for the following reasons:
  1. It is difficult to measure the high-frequency impedance of a network directly because the required test condition of an open/short circuit is impracticable, especially when the frequency is high.

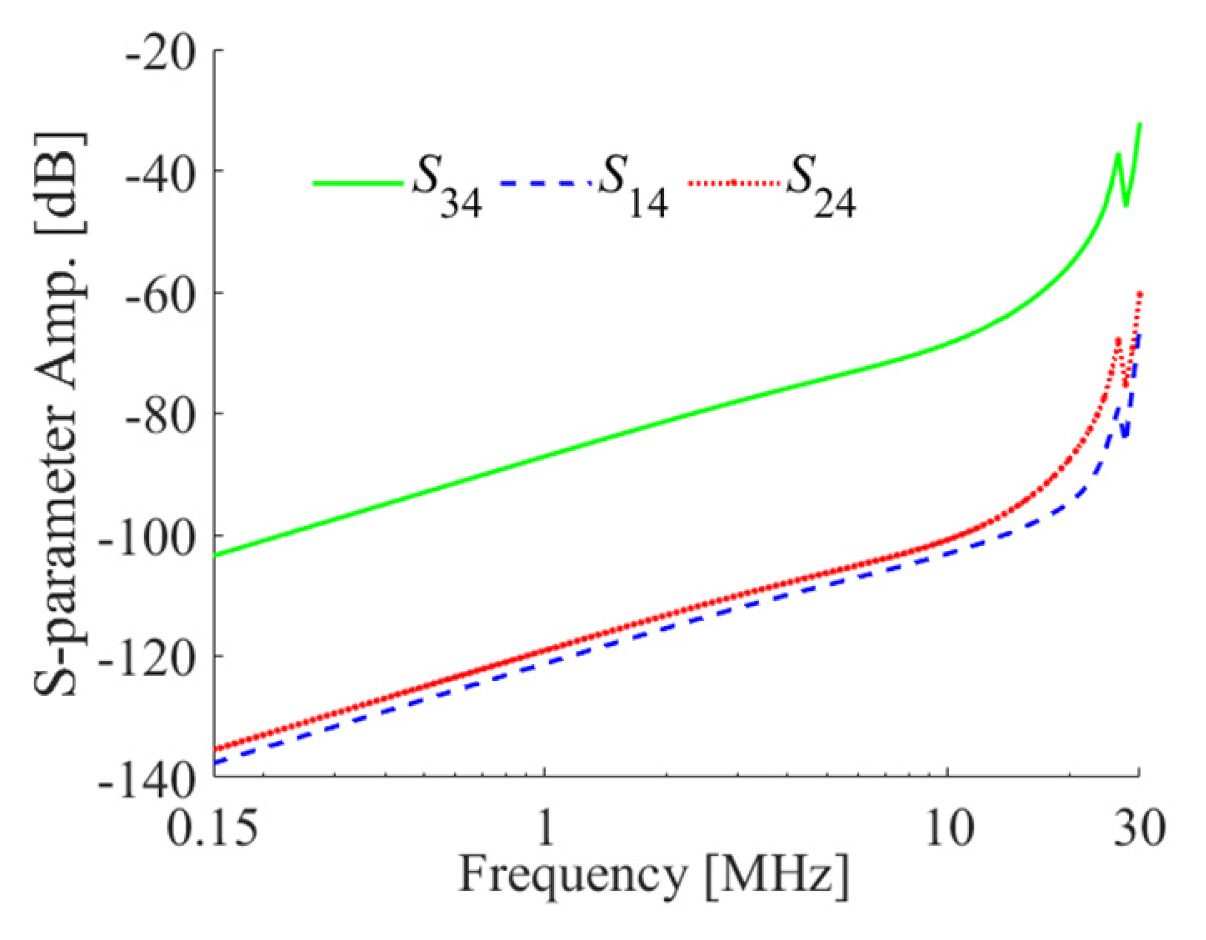
  2. Alternatively, the Z-parameter can be obtained from the S-parameter. However, the central network shown in Fig. 3 has nine ports—many more than the measurement ports of a common vector network analyzer (VNA).

  3. Even if we have a VNA with more than nine ports, the additional connection cables will aggravate the measurement noise because the components are dispersedly located in different positions in the EV.

The Z-parameter is calculated from the S-parameter, which is solved numerically using Feko [27]. Fig. 4 shows the Feko model. For the feasibility and efficiency of the numerical computation, the original model is simplified as follows:
  1. The nonmetallic components, comparatively small structures and electrical components, and low-voltage wiring harness are removed or smoothed.

  2. The thickness of the body’s steel sheet is ignored, and the vehicle’s body is reduced to a two-dimensional surface.

  3. The internal structures of the power components are not considered because they are packed in metal shells with fine shielding, and their size is comparatively small.

  4. Since only CM radiation is considered in this study, the high-voltage cables with their shield are compressed along the radial direction and modeled as lines in Feko.

  5. The line model of the high-voltage cables is directly generated from the centerline of the 3D harness model.

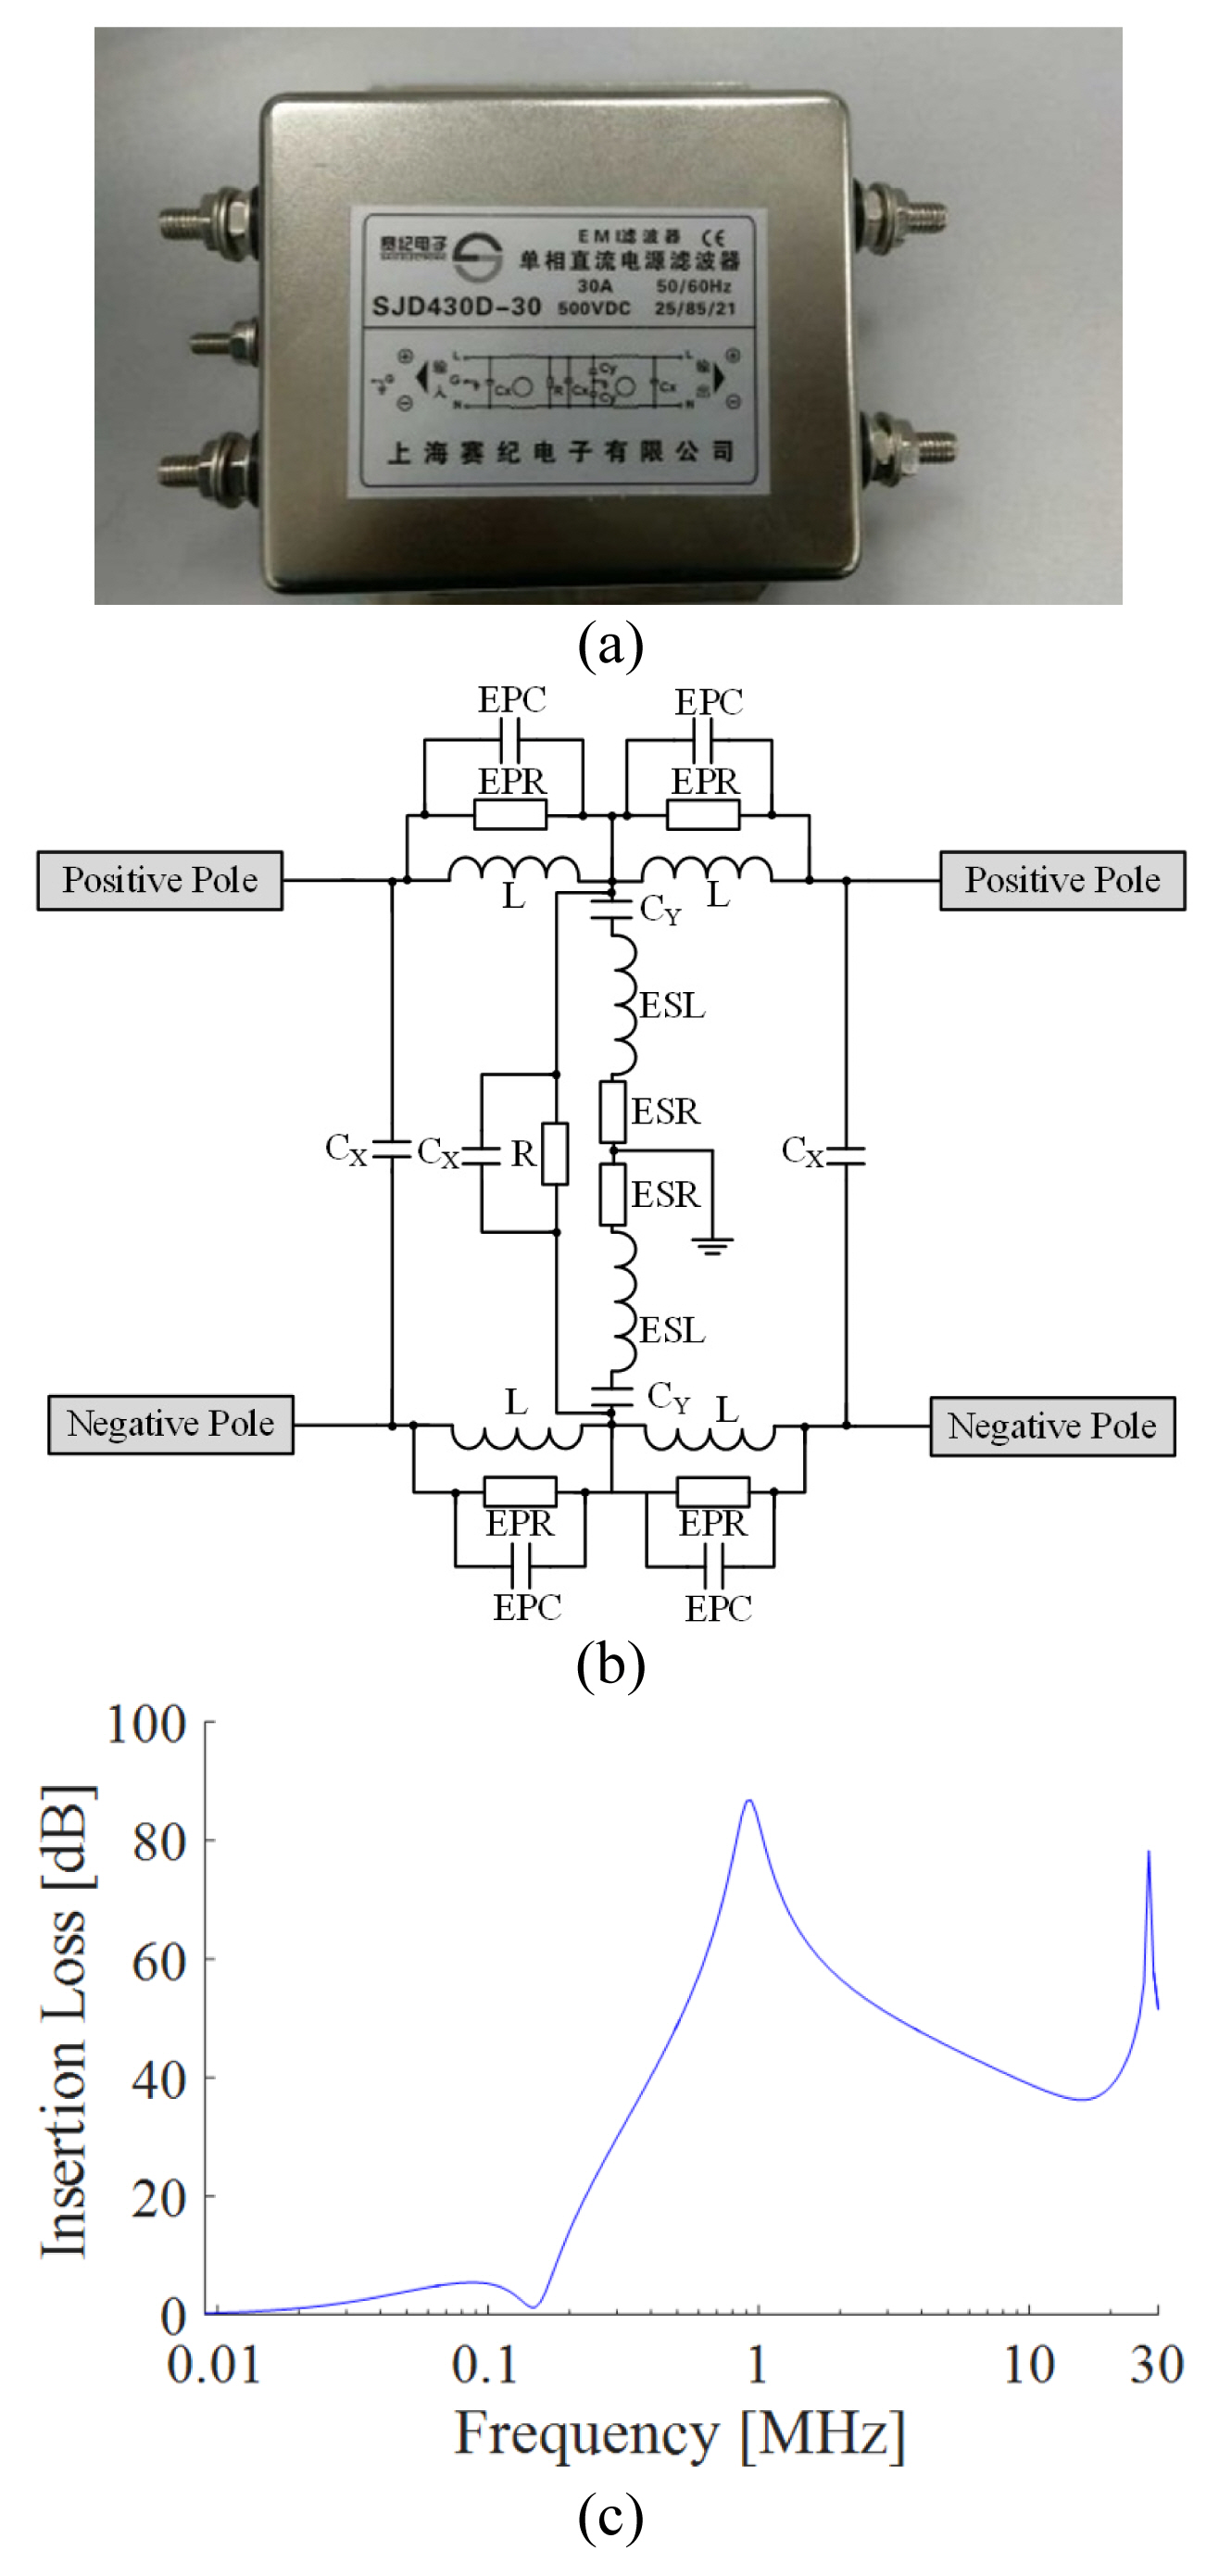
4. Measurement of Equivalent Circuit Parameters

As shown in Fig. 3, the equivalent circuit parameters include Vi,k, Zi,k, and Zs,k. Since it is challenging to measure the equivalent internal impedance and interference voltage directly under working conditions, in this study, it is assumed that the impedance is independent of the working state. Zi,k and Zs,k are then measured using a VNA with the EV powered off. Some equivalent internal impedance results are shown in Fig. 6.
The interference sources are modeled by Thevenin’s equivalent circuits as shown in Fig. 7 (a). With the measured Zi,k, ZL,k, and Ii,k, the interference voltage Vi,k is estimated using Eq. (5). Some measurement and estimation results are shown in Fig. 7 (b) and (c).
(5)
Vi,k=Ii,k(Zi,k+ZL,k).
The following are some remarks concerning the measurement of the equivalent circuit parameters and interference signals:
  1. Since only CM interferences are considered, the shielding layer and positive and negative wires of the high-voltage cables are combined and regarded as one wire.

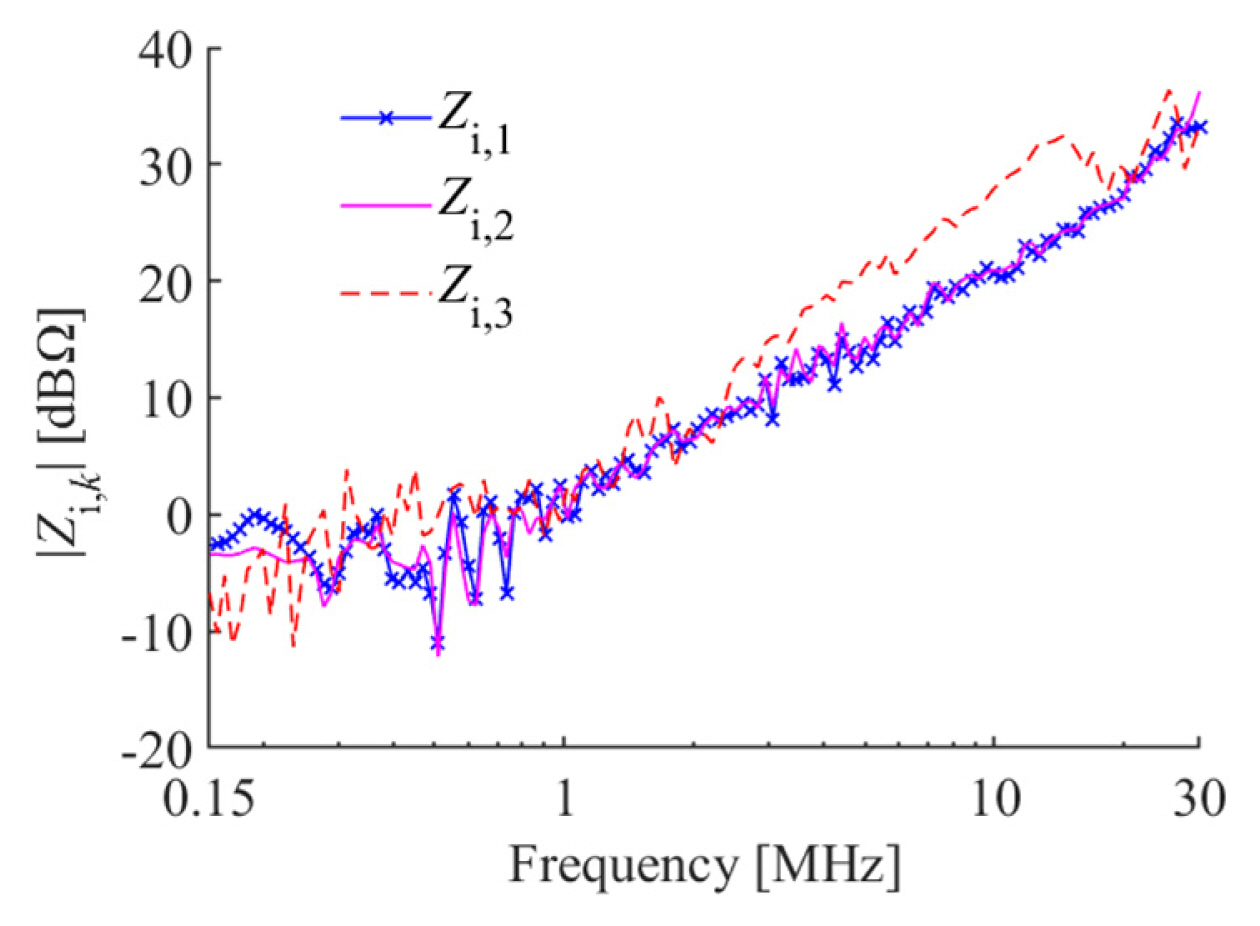
  2. The equivalent impedances Zi,k, Zs,k, and ZL,k are measured using a VNA with the EV powered off.

  3. To reduce parasitic effects when measuring the impedance, the wire is connected to the VNA through a coaxial adapter that is welded to the wire.

  4. The interference current Ii,k is measured using a broadband current clamp in the position closest to the component connector in the actual vehicle.

  5. To ensure accuracy when measuring the interference current, the working condition of the EV is the same as the SAE J551-5 requirement.

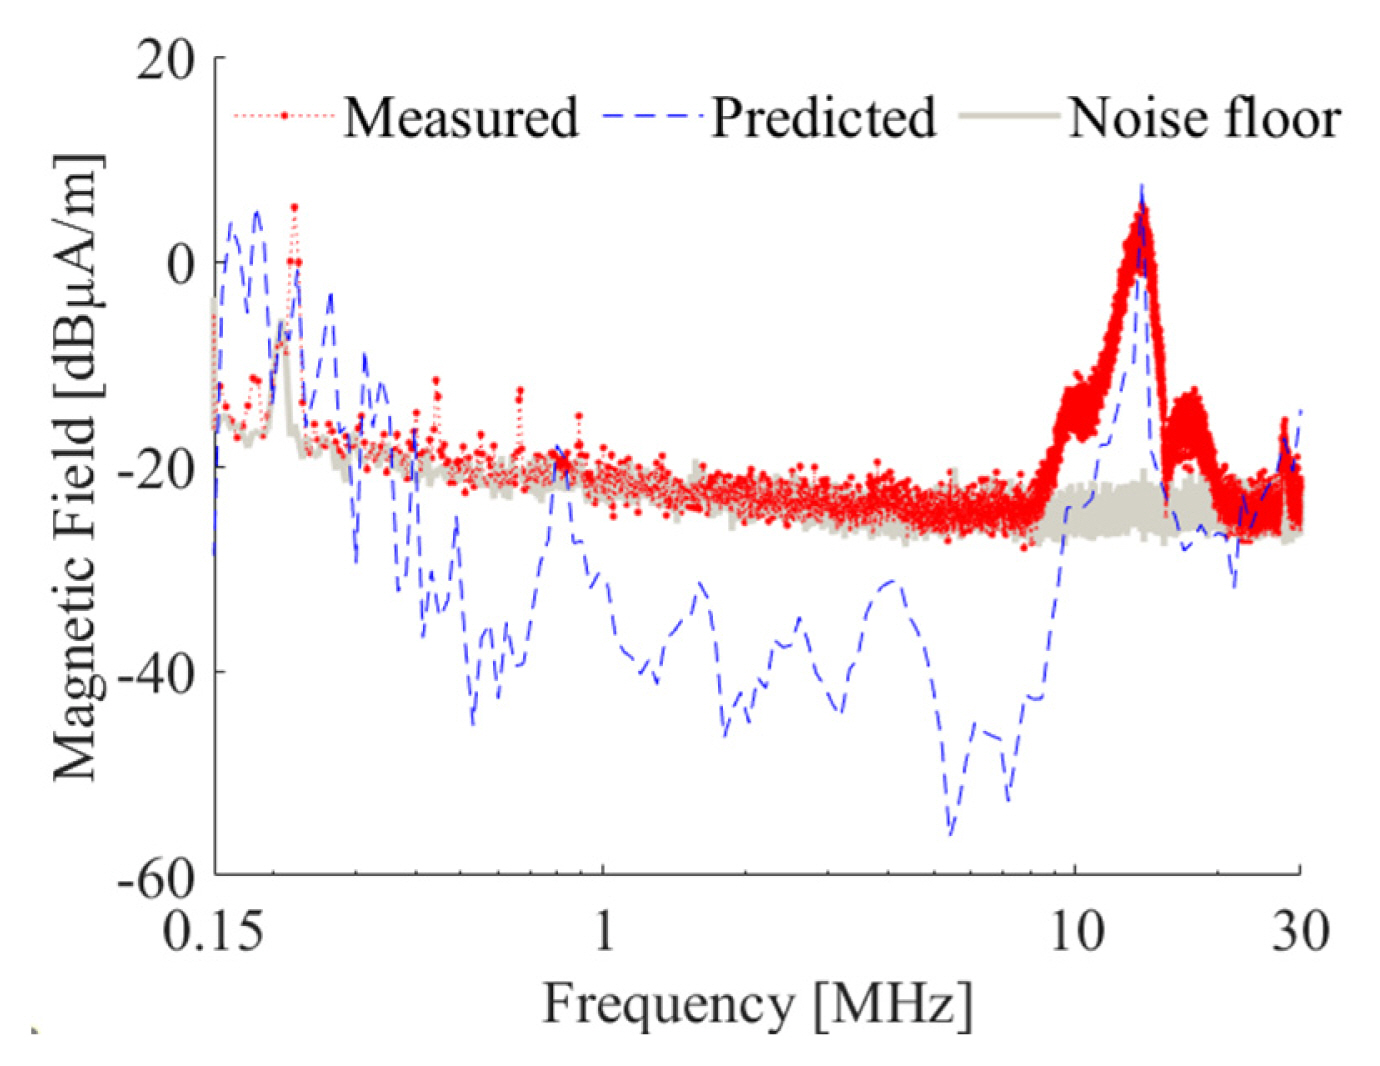
5. Model Accuracy Validation

With the measured parameters detailed in Sections 3 and 4, the vehicle’s magnetic emission is predicted by the network model presented in Section 2. To show the model’s accuracy, the prediction and measurement results are compared in Fig. 8.
As shown in Fig. 8, although the equivalent parameters of the interference sources are measured in a power-off state and some simplifications are made when constructing the Feko model, the overall trends of the prediction and measurement results are in good agreement with each other, and the peak point of the magnetic field at around 18.83 MHz, which exceeds the limit, is predicted accurately. This suggests that the assumptions and simplifications are reasonable because the influence of the unconsidered factors on the model parameters is negligible, or the contribution of the influenced parts on magnetic emissions is considerably smaller than that of others. In the frequency range of about 0.3 kHz to 8 MHz, the predicted magnetic field is much smaller than the measured one. A comparison of the measurement value with the noise floor of the EMC laboratory shows that the receiving antenna measures only the noise, suggesting that the actual emission generated by the EV is too small to be detected.

IV. Model-based Improvements

With a precise EMC model, the effectiveness of different solutions can be evaluated without conducting experiments. However, determining the main interference source to be dealt with depends on the engineer’s experience or several combinational vehicle test results. With the deterioration of EVs’ electromagnetic environments and the increase in the complexity of their electronic and electrical systems, it becomes increasingly difficult to identify the main technical factor effectively and efficiently. In this section, a systematic approach based on the network model described in Section III is presented to enable a diagnosis and improvements by analyzing the influence of technical factors on vehicle radiation.

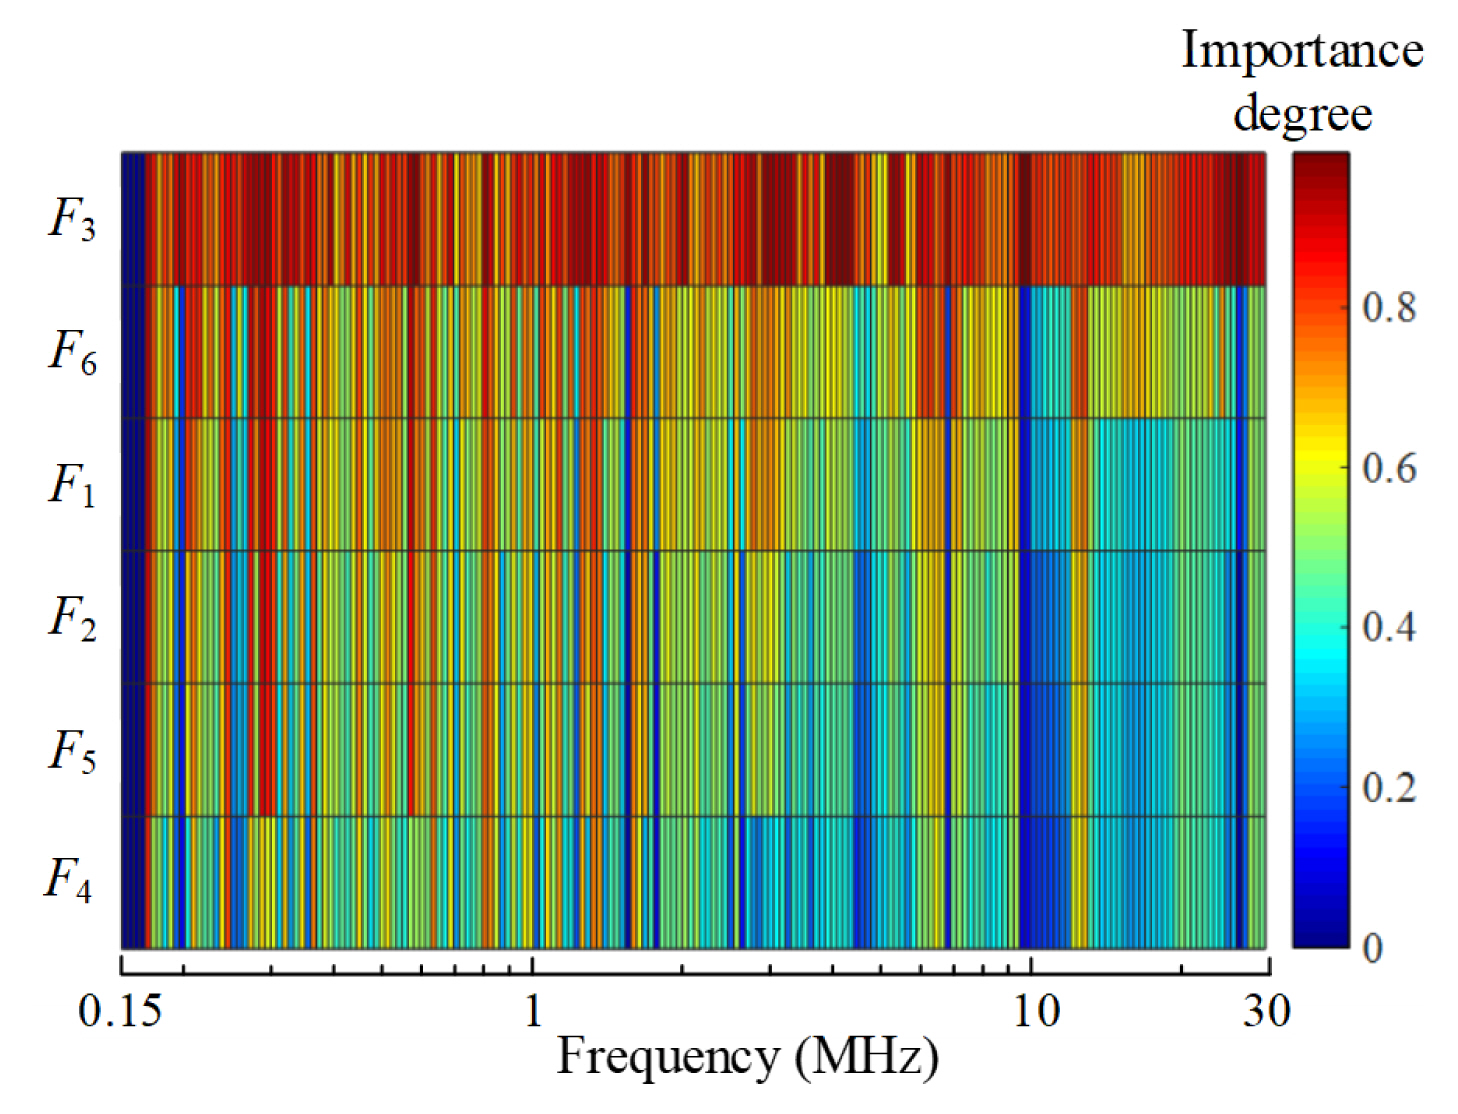
1. Evaluation Index Design

Engineers usually prefer to improve the component that causes the greatest interference. However, this becomes uneconomic if the emission reduction achieved by improving this factor is considerably less than other reductions. To determine the solution to the magnetic radiation problem more reasonably and systematically, the following two aspects are considered when designing the evaluation index:
  1. Contribution, which measures the emission generated by an influencing factor.

  2. Sensitivity, which characterizes the room for improvement.

Normally, the first aspect is easily evaluated by engineers based on their experience, technical information, and necessary vehicle/component test results. The second aspect is considerably more difficult to analyze quantitatively without an accurate and concise model, which should characterize all possible factors related to the vehicle’s magnetic emissions. Considering the parts included in the vehicle emission model described by Eq. (4), the technical factors to be evaluated in this study are (a) the interference voltage of the interference sources and (b) the strength of the coupling between the interference sources and the measurement antenna. For convenience, all factors are rearranged and denoted by Fk, k = 1, ···, 6. The relationships between the symbols and corresponding factors are listed in Table 1.
The contribution of Fk is measured according to the emission reduction when its value is set to zero:
(6)
Jc,k=H-Hk,
where Jc,k is the contribution of Fk, and H and Hk are the original magnetic emissions calculated by (4) with Fk = 0. A high Jc,k indicates that this factor contributes significantly to radiation and tends to be technically improved.
For the quantitative evaluation of sensitivity, it is assumed that the technical level and cost/effort required for improvement are similar for all components. The sensitivity index Js,k is calculated by
(7)
Js,k=H/Fk.
Essentially, the sensitivity Js,k indicates the room for improvement of factor Fk. To comprehensively consider these two completely different indexes, they are combined using the EWM to measure the importance of each factor, and the final evaluation index is designed as [28, 29]
(8)
Jk=ω1x1,k+ω2x2,k,x1,k=Jc,k-minkJc,kmaxkJc,k-minkJc,k,x2,k=Js,k-minkJs,kmaxkJs,k-minkJs,k,
where Jk is the evaluation score of factor Fk, and xc,k and xs,k are the minimum-maximum normalized contribution and sensitivity values, respectively. Using the EWM, the weight coefficient ωj, j = 1,2 is calculated [28][29] as
(9)
ωj=1+k=16(Pj,k·log10Pj,k)/ln 6j=12(1+k=16Pj,klog10Pj,k/ln 6),Pj,k=xj,k/k=16xj,k.
A higher evaluation score indicates that, technically, the corresponding factor is more important to the vehicle emission problem and should be preferentially improved considering both the generated emission and the cost/effort required.

2. Importance Analysis

With the designed evaluation index described in Section 1, the importance of the interference voltage and coupling can be calculated using the vehicle emission model (4). Some results are shown in Fig. 9.
To facilitate comprehension, the evaluation scores calculated by Eq. (8) are visualized in a heat map, with each row corresponding to an influencing factor and the evaluation score denoted by color. As can be seen in Fig. 10, at frequencies of about 18 MHz, at which the radiation exceeds the limit, the equivalent voltage of DC/DC (denoted by F3) and its coupling path with the measurement antenna (denoted by F6) lie in the top two rows. Thus, the interference generated by DC/DC should preferentially be attenuated.

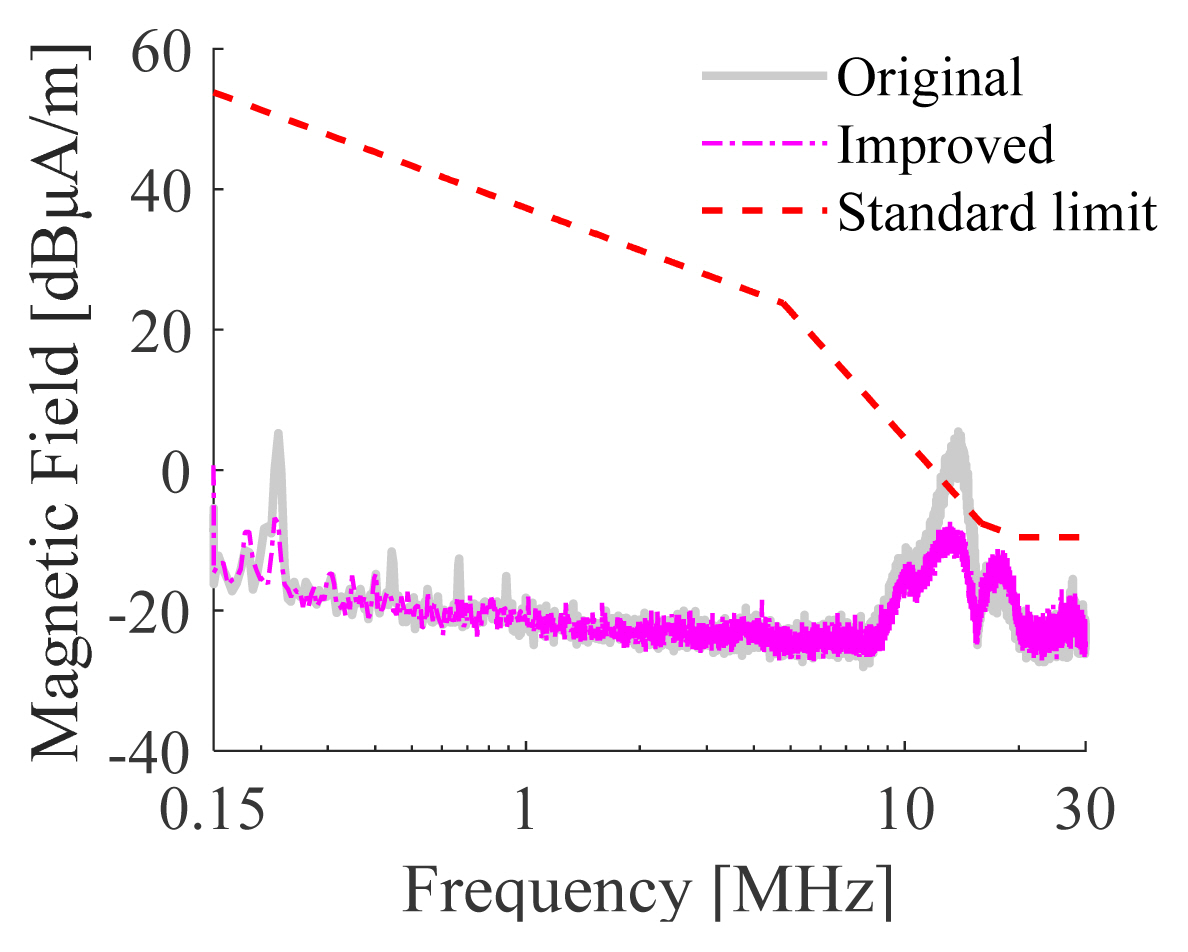
3. Improvement of Vehicle Magnetic Emission

Based on the analysis results presented in Section 2, a single-phase DC power supply filter (Shanghai Sai Ji Electronics Co., Ltd.) is selected considering the frequency range in which the magnetic emission exceeds the limit. The filter and its equivalent circuit model, which includes parasitic effects, are shown in Fig. 11.
The filter’s circuit parameters provided by the manufacturer are listed in Table 2.
Fig. 12 shows a comparison of the magnetic field generated using the selected filter with the standard limit and the original emission. With the filter, the peak at about 18 MHz is obviously reduced, and the vehicle’s magnetic emission satisfies the SAE J551-5 requirement. This application result shows that the proposed evaluation index can be used to effectively determine the main interference source. Although in this study, the proposed modeling and diagnosis methods are used to solve the EMC problem of an already developed EV, they can also be used at an early stage, when there is only a digital vehicle prototype.

V. Conclusions and Future Work

In this study, to improve EMC development efficiency, a model-based diagnosis and improvement method is proposed to address the magnetic emission problems of EVs. The analysis and application results can be summarized as follows:
  1. The proposed network model can accurately predict a vehicle’s low-frequency magnetic emissions. The impedance of the global network and the port node can be decoupled using the Z-parameter, and different methods can be used to obtain the parameters of the network model separately.

  2. The designed evaluation index can measure the influence of technical factors on a vehicle’s magnetic emissions by comprehensively considering their contributions and sensitivity. Engineers can directly determine the main interference source according to the evaluation score without resource-intensive experimental diagnosis and evaluation processes.

  3. The proposed EMI suppression approach can sufficiently attenuate the interference generated by DC/DC so that a vehicle’s low-frequency emission meets the SAE J551-5 requirement.

Certain questions about the problem details are worthy of further consideration:
  1. In this study, it is assumed that the equivalent impedance of the circuit node is independent of its working state. This assumption does not hold true if the circuit has high nonlinearities.

  2. The equivalent impedance of the circuit node is measured in a power-off state. Measuring the equivalent impedance when the circuit is activated remains a problem, especially for high-power switching circuits.

  3. During the improvement process, it is still a problem that how to use the proposed network model to quantitatively assess the effectiveness of the possible solutions.

  4. In this study, the proposed method is used to address a low-frequency emission problem. The problems about application to the prediction of high-frequency emission need to be further studied.

Acknowledgments

This work was supported by the State Key Laboratory of Automotive Safety and Energy (KFY2209), the Chongqing Automotive Collaborative Innovation Center (2022CDJDX-004), and the Chongqing Technology Innovation and Application Development Project (CSTB2022TIAD-KPX0139).

Fig. 1
Radiation emission test: (a) test site and (b) magnetic emission.
jees-2023-4-r-175f1.jpg
Fig. 2
Schematic diagram of an EV’s power system including a power distribution unit (PDU), a compressor, a battery, DC/DC, an onboard charger (OBC), a positive temperature coefficient heater (PTC), a battery heater, a drive inverter and a motor.
jees-2023-4-r-175f2.jpg
Fig. 3
Multi-port network model for magnetic emission prediction.
jees-2023-4-r-175f3.jpg
Fig. 4
Feko calculation model.
jees-2023-4-r-175f4.jpg
Fig. 5
Network parameters where Sjk and Zjk denote the S-parameter and Z-parameter of the central network between ports j and k, respectively: (a) S-parameter and (b) Z-parameter.
jees-2023-4-r-175f5.jpg
Fig. 6
Measured internal impedance.
jees-2023-4-r-175f6.jpg
Fig. 7
Node circuit and parameters: (a) Thevenin’s equivalent circuit for interference sources, (b) measured interference current, and (c) estimated interference voltage.
jees-2023-4-r-175f7.jpg
Fig. 8
Comparison of the measured and predicted vehicle magnetic emissions.
jees-2023-4-r-175f8.jpg
Fig. 9
Reduction of vehicle magnetic emission by the single-phase DC power filter.
jees-2023-4-r-175f9.jpg
Fig. 10
Importance analysis results.
jees-2023-4-r-175f10.jpg
Fig. 11
Single-phase DC power supply filter: (a) photograph of the product, (b) schematic diagram, and (c) insertion loss.
jees-2023-4-r-175f11.jpg
Table 1
Definitions of influencing factors
Symbol Influencing factors
F1 Equivalent interference voltage VI,1
F2 Equivalent interference voltage VI,2
F3 Equivalent interference voltage VI,3
F4 Coupling between interference source 1 and antenna
F5 Coupling between interference source 2 and antenna
F6 Coupling between interference source 3 and antenna
Table 2
Parameters of the single-phase DC power filter
Parameter* Unit Value
LC mH 0.45
CY nF 4.7
CX μF 470
R 0.47
EPC nF 67
ESL nH 7
ESR 0.05
EPR 16.8

* The definition can be seen in Fig. 11 (b).

References

1. D. Shen, D. Karbowski, and A. Rousseau, "A minimum principle-based algorithm for energy-efficient ecodriving of electric vehicles in various traffic and road conditions," IEEE Transactions on Intelligent Vehicles, vol. 5, no. 4, pp. 725–737, Dec;2020.
crossref
2. F. Gao, D. Dang, and Y. He, "Robust coordinated control of nonlinear heterogeneous platoon interacted by uncertain topology," IEEE Transactions on Intelligent Transportation Systems, vol. 23, no. 6, pp. 4982–4992, June;2022.
crossref
3. F. Gao, Y. Han, S. E. Xu, S. Li, and D. Dang, "Accurate pseudospectral optimization of nonlinear model predictive control for high-performance motion planning," IEEE Transactions on Intelligent Vehicles, vol. 8, no. 2, pp. 1034–1045, February;2023.
crossref
4. K. Pliakostathis, M. Zanni, G. Trentadue et al., "Assessment of a vehicle’s electromagnetic emissions under dynamic drive conditions," IEEE Transactions on Electromagnetic Compatibility, vol. 62, no. 6, pp. 2411–2422, Dec;2020.
crossref
5. E. Ivan, A. Fernando, J. Mateo et al., "Common mode noise propagation and effects in a four-wheel driven electric vehicle," IEEE Transactions on Electromagnetic Compatibility, vol. 60, no. 1, pp. 132–139, Feb;2018.

6. H. Jose, N. Artur, S. Jose, and A. Magno, "Proposal for a Brazilian regulation of electromagnetic compatibility applied to automotive vehicles," In: 2016 IEEE International Symposium on Electromagnetic Compatibility (EMC); Ottawa, Canada. pp 495–500, 2016.

7. R. G. Jobava, A. L. Gheonjian, J. Hippeli et al., "Simulation of low-frequency magnetic fields in automotive EMC problems," IEEE Transactions on Electromagnetic Compatibility, vol. 56, no. 6, pp. 1420–1430, Dec;2014.
crossref
8. F. Gao, H. Dai, J. Qi et al., "Vehicle-level electromagnetic compatibility prediction based on multi-port network theory," International Journal of Automotive Technology, vol. 20, no. 6, pp. 1277–1285, June;2019.
crossref pdf
9. F. Gao, H. Dai, C. Wu et al., "A topological approach to model and improve vehicle-level electromagnetic radiation," International Journal of RF and Microwave Computer-Aided Engineering, vol. 29, no. 10, pp. e21904July;2019.
crossref pdf
10. T. H. Kim, M. Kim, B. J. Ahn, and S. Y. Jung, "Study of EMC optimization of automotive electronic components using CAE," In: 2013 International Conference on Electrical Machines and Systems (ICEMS); Busan, Korea. pp 26–29, 2013.

11. N. R. Bernas, "Electromagnetic compatibility design modification considerations in electronic equipment," In: 2011 IEEE Symposium on Product Compliance Engineering Proceedings; San Diego, CA, USA. pp 1–5, 2011.
crossref
12. H. T. Chun, S. H. Han et al., "Converter switching noise reduction for enhancing EMC performance in HEV and EV," In: PCIM Europe 2016; International Exhibition and Conference for Power Electronics, Intelligent Motion, Renewable Energy and Energy Management; Nuremberg, Germany. pp 1–8, 2016.

13. M. C. Piazza, M. Luna, A. Ragusa, and G. Vitale, "An improved common mode active filter for EMI reduction in vehicular motor drives," In: 2011 IEEE Vehicle Power and Propulsion Conference; Chicago, IL, USA. pp 1–8, 2011.
crossref
14. C. Wu, F. Gao, H. Dai, and Z. Wang, "A topology-based approach to improve vehicle-level electromagnetic radiation," Electronics, vol. 8, no. 3, pp. 364–376, 2019.
crossref
15. S. Chen, T. W. Nehl, J. S. Lai, and X. Huang, "Towards EMI prediction of a PM motor drive for automotive applications," In: Eighteenth Annual IEEE Applied Power Electronics Conference and Exposition, APEC ‘03; Miami Beach, FL, USA. pp 14–22, 2003.
crossref
16. Y. Baba and V. A. Rakov, "Applications of the FDTD method to lightning electromagnetic pulse and surge simulations," IEEE Transactions on Electromagnetic Compatibility, vol. 56, no. 6, pp. 1506–1521, Dec;2014.
crossref
17. S. Jeschke, H. Hirsch, M. Trautmann, and M. Maarleveld, "EMI measurement on electric vehicle drive inverters using a passive motor impedance network," In: 2016 Asia-Pacific International Symposium on Electromagnetic Compatibility (APEMC); Shenzhen, China. pp 292–294, 2016.
crossref
18. S. Runke, V. Hansen, J. Streckert, M. Clemens, K. U. Rathjen, and S. Dickmann, "IEMI analysis of critical infrastructures by simulations using a multi-method coupling strategy," In: 2014 International Symposium on Electromagnetic Compatibility; Gothenburg, Sweden. pp 1–4, 2014.
crossref
19. G. Liu, C. Chen, and Y. Tu, "Anticipating full vehicle radiated EMI from module-level testing in automobiles," In: 2002 IEEE International Symposium on Electromagnetic Compatibility; Minnesota, MN, USA. pp 982–986, 2002.

20. C. C. Chen, "Examination of electronic module immunity using transfer functions," In: 2005 International Symposium on Electromagnetic Compatibility; Chicago, IL, USA. pp 756–761, 2005.

21. H. Funato, J. Li, and M. Takahashi, "Vehicle-level analysis technique for EMC design of automotive inverters," Hitachi Review, vol. 64, no. 8, pp. 501–505, 2015.

22. "Performance Levels And Methods Of Measurement Of Magnetic And Electric Field Strength From Electric Vehicles, Broadband, 9 kHz to 30 MHz," SAE J, pp. 551–5, 2012.
crossref
23. A. Stippich, C. H. Van Der Broeck et al., "Key components of modular propulsion systems for next generation electric vehicles," CPSS Transactions on Power Electronics and Applications, vol. 2, no. 4, pp. 249–258, December;2017.
crossref
24. D. Muller, M. Beltle, and S. Tenbohlen, "EMI suppression of a DC–DC converter using predictive pulsed compensation," IEEE Transactions on Electromagnetic Compatibility, vol. 63, no. 6, pp. 2134–2142, July;2021.
crossref
25. B. Bae, J. Kim et al., "Numerical verification of dielectric contactor as auxiliary loads for measuring the multiport network parameter of vertical interconnection array," IEEE Access, vol. 8, pp. 117997–118004, June;2020.
crossref
26. A. Sona, "Augmented Thevenin model for the harmonic analysis of switching circuits," IEEE Transactions on Electromagnetic Compatibility, vol. 62, no. 4, pp. 1342–1348, Aug;2020.
crossref
27. M. Schoeman, E. A. Attardo, and J. S. Castany, "Recent advances to the Feko integrated cable harness modeling tool," In: 2019 International Symposium on Electromagnetic Compatibility-EMC EUROPE; Barcelona, Spain. pp 1071–1075, 2019.
crossref
28. A. Delgado and I. Romero, "Environmental conflict analysis using an integrated grey clustering and entropy-weight method: a case study of a mining project in Peru," Environmental Modelling & Software, vol. 77, Supplement. pp. 108–121, March;2016.
crossref
29. Y. Cui and Y. Fang, "Research on PCA data dimension reduction algorithm based on entropy weight method," In: 2020 2nd International Conference on Machine Learning, Big Data and Business Intelligence (MLBDBI); Taiyuan, China. pp 392–396, 2020.

Biography

jees-2023-4-r-175i1.jpg
Prof. Gao received his M.S. and Ph.D. from Tsinghua University in 2003 and 2007, respectively. From 2007 to 2013, he worked as a senior engineer at Chang’an Auto Global R&D Centrer, where he led several projects related to electromagnetic compatibility, durability tests of electronic modules, advanced driving assistance system, and engine control. He is currently a professor at the College of Mechanical and Vehicle Engineering of Chongqing University. His current research interests include the development of vehicle-level EMC and intelligent and connected vehicles. He has coauthored more than 100 peer-reviewed journal and conference papers and has been granted over 20 patents in China. He has received the Best Award of Automatic Driving Technology of the International Intelligent Industry Expo (2018), the Technical Progress Award of the Automotive Industry (2017, 2018, and 2020), the Technical Progress Award of Chongqing (2019 and 2021), the Special Application Award of NI Graphics System Design (2015), and the Best Paper Award of the Chongqing Electric Motor Society (2016).

Biography

jees-2023-4-r-175i2.jpg
Mingli Xu was born in Xiang Yang, Hu Bei Province, in 2000. He received a B.S. degree in automotive engineering from the Wuhan University of Technology in 2022 and is currently pursuing an M.S. in automotive engineering at Chongqing University. His research is intelligent optimization technologies.

ABOUT
ARTICLE CATEGORY

Browse all articles >

BROWSE ARTICLES
AUTHOR INFORMATION
Editorial Office
#706 Totoo Valley, 217 Saechang-ro, Yongsan-gu, Seoul 04376, Korea
Tel: +82-2-337-9666    Fax: +82-2-6390-7550    E-mail: admin-jees@kiees.or.kr                

Copyright © 2024 by The Korean Institute of Electromagnetic Engineering and Science.

Developed in M2PI

Close layer
prev next