Motion Region Detection and Pattern Extraction Algorithm of a Motion Image Based on a Radar Sensor
Article information
Abstract
In this paper, a motion region detection and pattern extraction algorithm is proposed for motion recognition based on the image as the distance changes between the radar sensor and human motion. This algorithm, which was developed by combining the characteristics of the radar motion image and image processing techniques, compensates for the discontinuous data that can occur when removing clutter for motion data detection and extracts motion patterns applicable to the recognition learning field. According to the motion data measured by a radar sensor, the algorithm performance is verified by an experiment.
I. Introduction
Existing motion recognition technology is conducted by capturing human movements through visual images using cameras. Recently, Google has implemented motion recognition using a chip through “Soli” [1]. Motion recognition using this miniaturized radar chip technology can be applied to a wide range of applications, including internet of things and wearable devices. Among all the motion recognition technologies, the radar-applied motion recognition can be identified in both natural environment and non-visual situations. Radar for motion recognition is mainly used for ultra-wideband (UWB), frequency- modulated continuous wave (FMCW) radar. Comparing the two radars, the UWB radar has a lower transmission power and a shorter coverage, but its resolution is more precise and its response rate is higher than that of the FMCW radar.
A typical technique for motion recognition using a radar sensor is to recognize pattern by extracting micro-Doppler based on a CW radar [2]. Based on these techniques, motion is recognized through the amplitude [3, 4] of the received signal reflected in the motion or through the Doppler information [5, 6] of the received signal. Recognition studies based on machine learning and deep learning are actively being pursued [4, 6–8].
Motion is also recognized through images resulting from the changes in the distance between the radar sensor and human motion [9]. First, the radar-received signals are accumulated, and signal processing is performed to remove the clutter in a two (pulse frame–sample)-dimensional image. Second, feature extraction and learning of the motion image using the histogram of oriented gradient/support vector machine (SVM) are conducted. In [9], a good recognition performance was verified with the data of actual measured human motion. However, motion recognition based on distance changes is essential to the process to reject a fixed clutter. This process may remove some of the motion data. That is, when recognizing motion that requires sophistication, performance may be degraded.
In this paper, a motion region extraction and pattern extraction algorithm is proposed for motion recognition based on the image as the distance changes between the radar sensor and human motion. This algorithm, which was developed by combining the characteristics of radar motion images and image processing techniques, compensates for the discontinuous data that can occur when removing clutter for motion data extraction and extracts motion patterns applicable to the recognition learning field. Using the motion data measured by the radar sensor, the algorithm performance is verified by an experiment.
This paper is organized as follows. Section II discusses the concept and the result of clutter processing for motion data extraction. Section III describes the proposed algorithm step by step based on the results in Section II. Section IV presents the processing result for the algorithm in Section III. The paper is concluded in Section V.
II. Clutter Removal Processing for Motion Data Extraction
Clutter removal is recognized as a change in the distance between the radar sensor and human motion. This process of removing leakage signals from radar sensors and the effects of fixed clutter such as on objects [9] is essential. By performing the moving average filter along the pulse axis, the effect of the clutter can be removed, and only motion data are extracted. The clutter removal process can be expressed as
where xp,k is the data of the received motion image, and p and k are the pulse frame and the sample index of a single pulse, respectively. The raw data and clutter removal processing results are shown in Fig. 1.
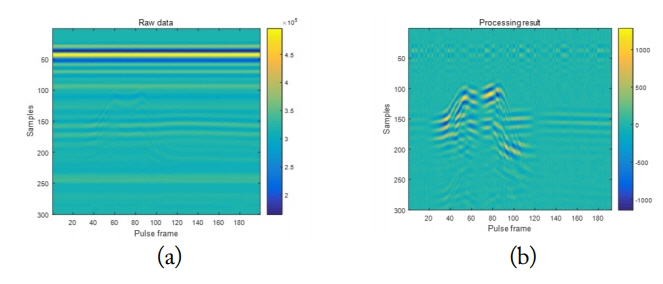
Result of the clutter removal process: (a) raw data and (b) clutter removal.
The x-axis and y-axis in Fig. 1 represent the pulse frame and the samples of a single pulse, respectively. Motion data can be extracted by removing the clutter, as shown in Fig. 1. However, discontinuous motion data may occur when the motion is maintained at the same distance for a while or during the state of motion transition. That is, compensation is required through the tendency of the adjacent motion regions.
III. Proposed Motion Region Detection and Pattern Extraction Algorithm
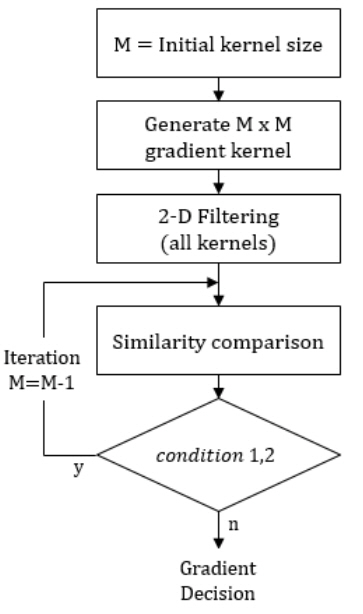
In this section, the motion region detection and pattern extraction algorithm are proposed for motion recognition based on the distance changes between the radar sensor and human motion. This algorithm can extract the pattern of motion image and compensate for the discontinuous motion image in Fig. 1. The flow chart of the algorithm is illustrated in Fig. 2.

Flow chart of the pattern extraction algorithm.
1. Region of Interest (ROI)
ROI extraction is performed to remove leakage signal from the radar sensor. In particular, leakage signal data that have not been removed from the signal processing can degrade the performance of the algorithm. In Fig. 1(a), the amplitude of the signal is strong at the 40th–50th sample intervals. Therefore, it can be estimated as a leakage signal.
2. Binarization Process
The binarization process extracts the motion data and performs binarization. The motion data are extracted by processing the average of the image and the threshold value of each sample. The flow chart of the binarization process is shown in Fig. 3.
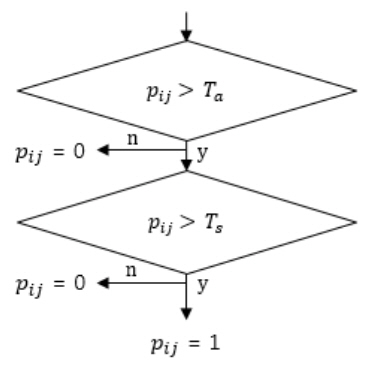
Flow chart of the binarization process.
The equation of the threshold for the binarization process is as follows:
where aa and as represent the average value of the image and of each equivalent sample, respectively, ka and ks are the threshold scale factors, and Ta and Ts are the calculated threshold value. As the amplitude of the motion data is greater than the average value of the image or sample, extracting the motion data is possible.
3. Motion Region Detection
To extract the pattern of the motion correctly, only the detection of the motion region is required. The flow chart of the motion region detection is illustrated in Fig. 4.
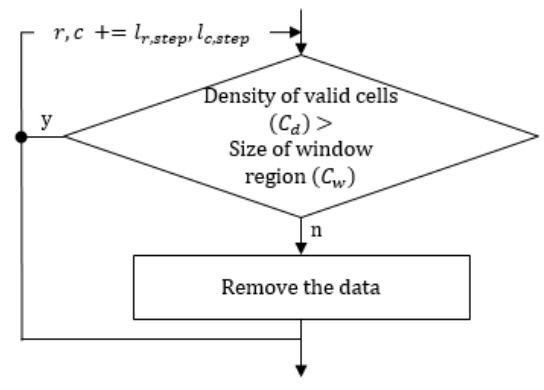
Flow chart of the motion region detection.
Based on the data after the binarization process, the motion region is detected through the density of motion data. The region for determining the density is expressed as a window region. To improve the processing speed of the calculation, the density of the region is calculated while moving to the step size (lr,step, lc,step). The conditional inequality for determining density is
where kd is the ratio of the window region size and should be properly set to the motion data and the resolution of the radar sensor. If Eq. (4) is not satisfied, the data are removed. The concept of motion region detection is presented in Fig. 5.

Motion region detection concept.
Data are maintained or removed by calculating the density of the window region.
4. Gradient Estimation by Region
The detected motion region is divided into small regions, and the gradient for each region is estimated. The acquired motion data are an image of a time–range axis that accumulates into a radar pulse. Therefore, a gradient in the vertical direction does not occur. The gradient estimation uses a kernel- type method using two-dimensional (2D) filtering instead of a general image processing method. Fig. 6 shows the shape of the gradient kernel.
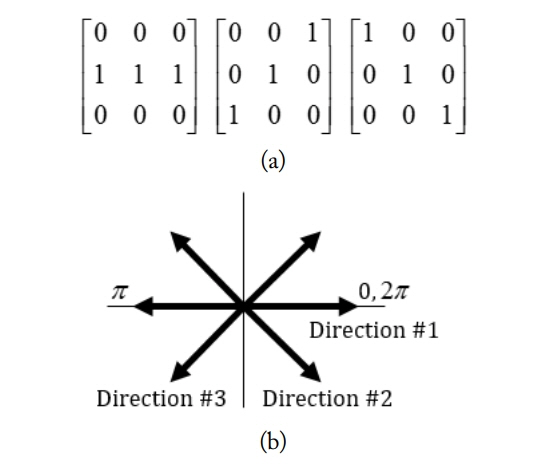
Shape of the gradient kernel: (a) gradient kernel matrix and (b) direction of the gradient kernel.
Fig. 6(a) shows the gradient of the kernel matrix, and Fig. 6(b) presents the direction. The vertical gradient is not taken into account because of the measured radar motion characteristics. The kernel size is determined by the size of the region to be processed. The similarity between the region and the kernels is calculated through 2D filtering. Fig. 7 shows the flow chart that estimates the gradient by region based on the kernel.
Gradient estimation flow chart by region.
As shown in Fig. 7, the gradient of the region is estimated by calculating the similarity with the kernel. The two conditions in Fig. 7 are as follows:
Condition 1: no similarity for all-kernels
Condition 2: two or more of the most similar calculated values are the same
If the result of calculating the similarity with the Mk × Mk kernel is included in the above condition 1 or 2, the Mk−1× Mk−1kernel will repeat the similarity calculation to estimate the gradient.
5. Pattern Extraction by Region
To estimate and extract patterns for each region, motion patterns are estimated by comparing the gradients between the region and the adjacent region. The flow chart for the gradient estimation is presented in Fig. 8.
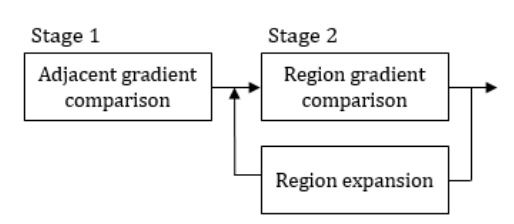
Flow chart of the pattern extraction by region.
The estimation of the gradient of the region consists of two stages. The first stage compares the gradients of the adjacent regions in the same direction. For example, in Fig. 9, if the gradient in the red square region Rij is in direction 3, the gradient in regions Ri+1,j−1and Ri−1,j+1in direction 3 will be compared. If all three regions have the same direction 3, the gradient is determined in direction 3.
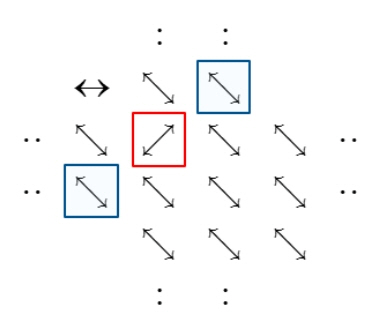
Concept of the first stage.
However, if any of the compared gradient is different as shown in Fig. 9, then the gradient in region Rij is most likely incorrectly estimated. This condition can degrade performance when extracting motion. Therefore, in this case, the gradient of the adjacent regions should be compared. Fig. 10 shows the concept of the second stage in estimating the patterns from the gradients in the adjacent regions.

Concept of the second stage.
In Fig. 10, the yellow box is the left region, and the green box is the right region. The gradient of the red box Rij is estimated by determining the dominant gradient of both regions. As direction 2 is dominant in both regions, Rij is determined in direction 2. If there is no dominant gradient in the region, the comparison region will be extended, as shown in Fig. 11.

Region expansion in the second stage.
Then, the motion pattern of the region is simplified based on the estimated gradient on the left and the right. A pattern matrix of a 5× 5 size is shown in Fig. 12.

A 5 × 5 pattern matrix.
The type names in Fig. 12 are in the left and right directions. For example, if the dominant gradient is direction 2 in the left region and the dominant gradient is direction 3 in the right region, then the pattern type is “Type 23”. The image of the motion region is replaced by a pattern matrix based on the estimated gradient.
IV. Experimental Result
To verify the performance of the proposed algorithm, we experiment with the measured human motion images based on the radar sensor. The two measured motions are shown in Fig. 13. The signal processing algorithm results in [9] on motion are shown in Fig. 14.

Two motions in the experiment.
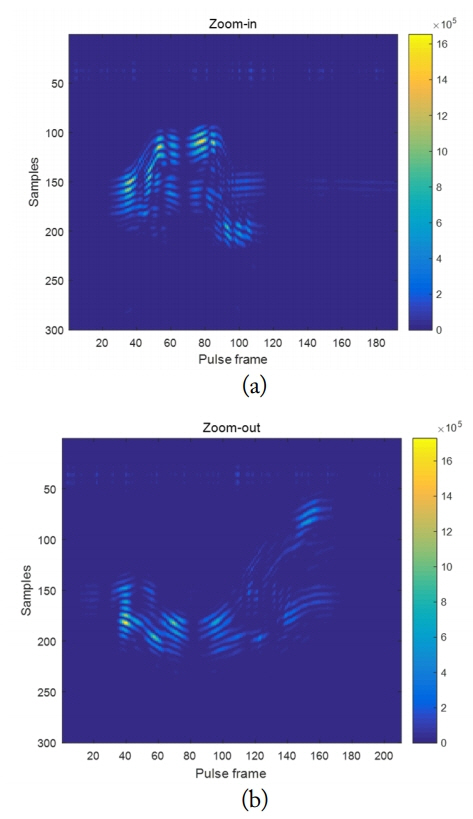
Signal processing result: (a) zoom-in and (b) zoom-out.
The UWB radar sensor is used, and the sampling interval is 0.005 m. The ROI is processed to acquire an image after the 70th sample to remove the leakage signal in Fig. 1. Then, binarization is performed through the threshold processing based on the average value of the image and each sample. Ta and Ts are obtained by analyzing the distribution of the measured radar image. The two times the average of ka and ks, respectively, are appropriate. The binarization processing result of the zoom-in motion image when ka and ks are 2, respectively, is shown in Fig. 15.
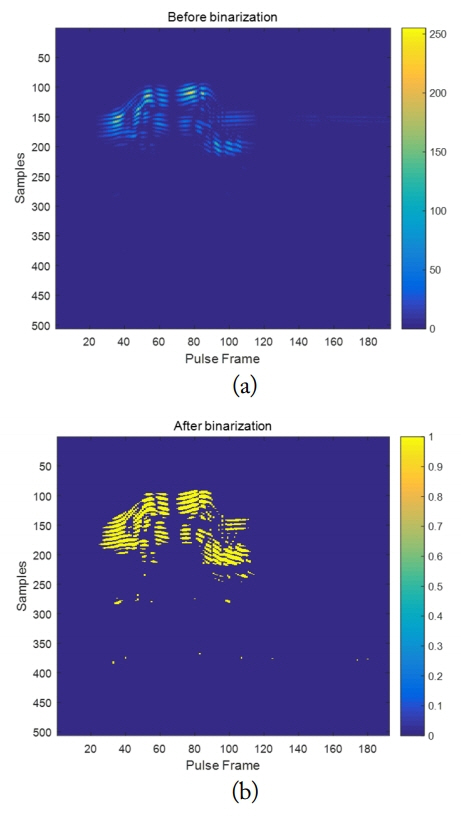
Binarization processing result: (a) before binarization and (b) after binarization.
Fig. 15 shows the extracted motion data after binarization. However, the non-motion data are incorrectly extracted in Fig. 15(b). These data are removed with the following motion region detection method. The result of the motion region detection using the 10 × 10 window region is presented in Fig. 16. The step size of the row and column are respectively set to ½of the region length, and density is set to ⅓ of the window region. This process detects only the motion region and shows that the wrongly detected data in Fig. 15 are removed.

Motion region detection result: (a) motion region detection and (b) display of valid motion region.
Based on the detected motion region, the region is divided for the gradient calculation by region. Fig. 17 shows the result of estimating the gradient by dividing it into a 7 × 7 matrix.
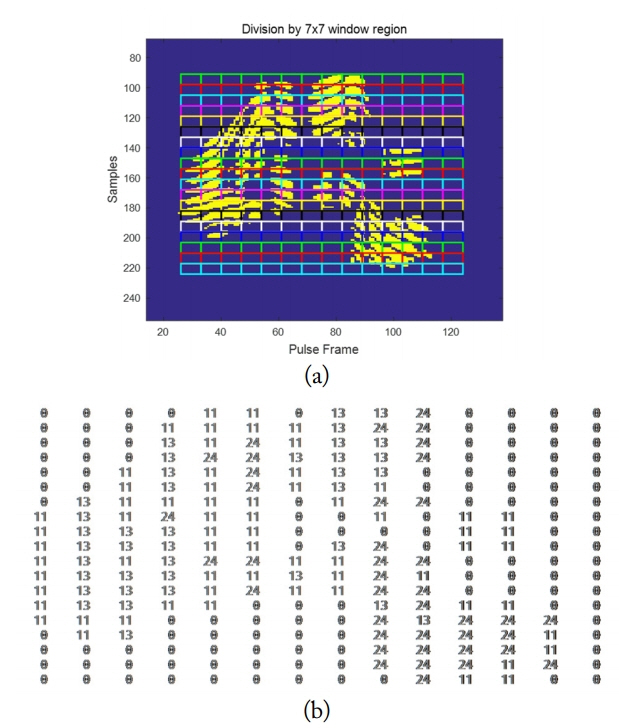
Result of estimation of the gradient by region: division by the 7 × 7 window region and (b) gradient estimation result.
The results of estimating the gradient using the kernel matrix from 7 × 7 to 3 × 3 are shown in Fig. 17(b). The numbers in Fig. 17(b) are the direction shown in Fig. 6. The numbers 11, 24, and 13 in Fig. 15(b) are in directions 1–3, respectively. Fig. 18 shows the pattern extraction result based on the estimated gradient.

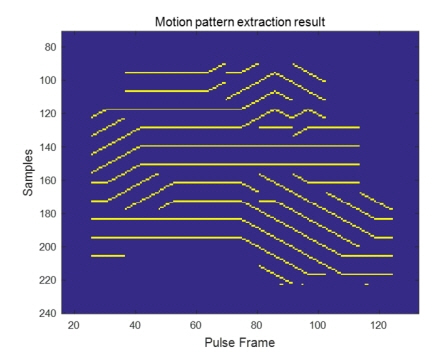
Motion pattern extraction result.
The existing motion image is simplified to one width of the image through pattern estimation and extraction. This process also compensates for the discontinuous interval motion data that occurs during the removal of the clutter in Fig. 1. If the algorithm is performed iteratively by expanding the region unit of the gradient, the motion image can be further simplified. The result of iteratively extracting the gradient window region to 7 × 7 and 11 × 11 is shown in Fig. 19.
Iterative motion pattern extraction result.
The radar image depends on the speed and range of motion. Therefore, the window region size and the number of iterations should be determined by human motion and the sampling interval of the radar sensor. The pattern extraction results for the zoom-out motion are shown in Fig. 20.
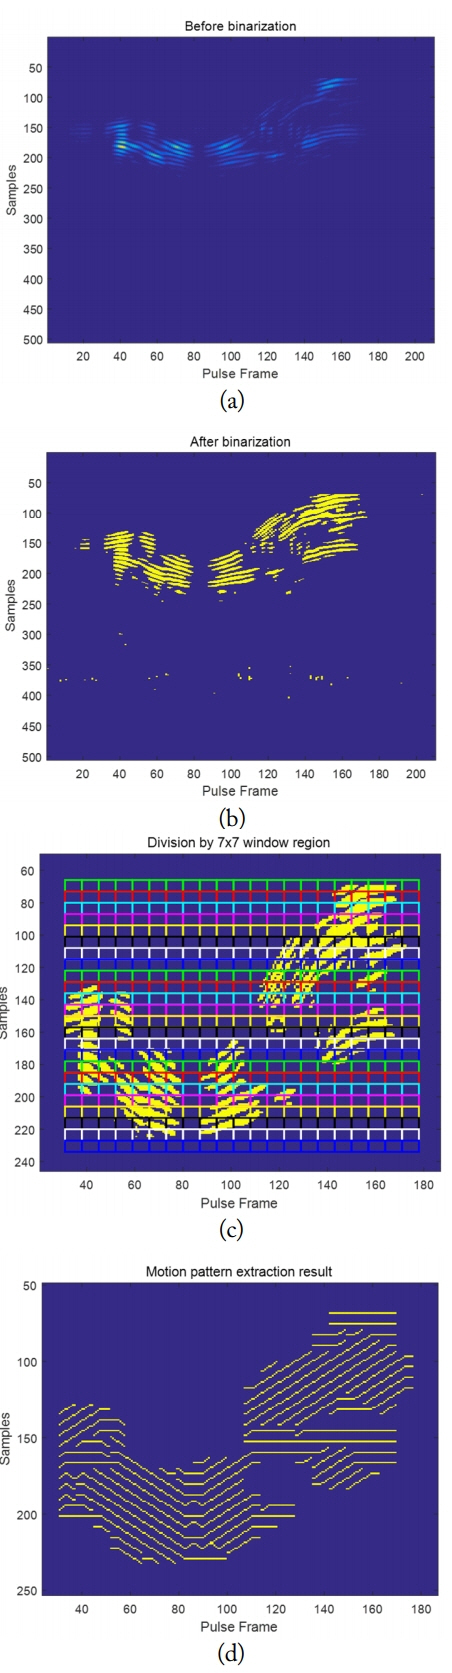
Experimental results of the zoom-out motion: (a) raw data, (b) motion region detection, (c) division by the 7 × 7 window region, and (d) motion pattern extraction result.
The performance of the proposed algorithm is verified through a motion recognition experiment. Each motion uses 50 data sets for the experiment. Iteratively performing with the window region size of 7 × 7, the 11 × 11 window region extracted the patterns of two motions and recognized them through SVM learning. The k-fold cross-validation was applied to increase the statistical reliability of the experiment. The motion recognition experiment results are shown in Table 1.
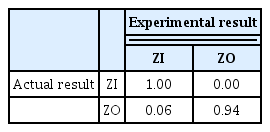
Results of the motion recognition experiment
The learning result of the zoom-in (ZI) motion shows a 100% recognition rate and that of the zoom-out (ZO) motion shows a 94% recognition rate.
V. Conclusion
A motion region detection and pattern extraction algorithm is proposed for motion recognition based on the image as distance changes between the radar sensor and human motion. This algorithm, which was developed by combining the characteristics of radar motion images and image processing techniques, compensates for the discontinuous data that can occur when removing clutter for motion data detection and extracts motion patterns that are applicable to the recognition learning field. Based on the motion data measured by the radar sensor, the algorithm performance is verified by an experiment. Although the performance is good in the experiment, the recognition performance can be further improved by performing the machine learning by applying hyperparameter learning and so on.
However, measuring the motion on the radar side distorts the image. Therefore, studies should recognize the motion of images that are distorted when measured on the side of the radar sensor. In future studies, we will examine the radar-based motion recognition based on deep learning, which has recently become popular.
References
Biography

Jinseop Lee obtained his B.S. and M.S. degrees in electronic engineering from Konkuk University, Seoul, Korea, in 2014 and 2016, respectively. Since 2016, he has been a researcher at Hanwha Systems. His research interests include 2D/3D image detection/tracking, deep learning, speech recognition, and radar/image signal processing.