Prediction of Radio-Wave Propagation in a Shield Room: Measurement, Simulation, and Theoretical Method
Article information
Abstract
In this paper, electromagnetic wave analysis was performed efficiently in a large structure using the theoretical method. While taking into consideration the important assumptions of the employed theoretical method, we created an environment for measurement and simulation. A shield room with an aperture was selected as the target structure, and a measurement system based on frequency domain was constructed and used. Using the simulation tool, Wireless Insite, electromagnetic wave analysis was performed by modeling the measurement environment. To verify the efficiency and accuracy of the theoretical method, the results of the actual measurement, the commercially available simulation tool, and the theoretical method were compared. These results showed that the theoretical method can be more efficiently interpreted than the commercially available simulation tool in an electrically large structure.
I. Introduction
Modern society can be defined as hyper-connected society, and various network systems, such as the Internet of Thing (IoT) and machine to machine (M2M), propagation technology are being developed. Therefore, in this hyper-connected society, electromagnetic (EM) wave dependency has increased in major infrastructures such as telecommunications, transportation systems, and emergency/government services. As a result, threats from intentional or unintentional EM fields that interfere with the function of these critical infrastructures have also been increasing [1]. However, since most of these important infrastructures are civilian facilities, they are not designed to be resistant to high frequency and high-power EM interference. Therefore, they are particularly vulnerable to intentional electromagnetic interference (IEMI) attacks. Particularly, IEMI might result in significant consequences, since it generates intentional and malicious EM energy that confuses or damages the network system’s signals. Research related to this issue has been actively conducted using numerical analysis techniques such as finite-difference time-domain (FDTD), method of moment (MoM), and the ray tracing method. However, since most of the critical infrastructures are quite complex and large, there are also constraints caused by their greatly increased time consumption and required memory.
In this paper, we solve the above problem by linking electromagnetic topology (EMT) [2, 3] with the power balance (PWB) method. Using EMT, complex systems can be represented as simple topological diagrams. The PWB method was first proposed to solve the high frequency response in a single structure [4]. This method is based on probability theory, and the most important assumption is that, if the considered is sufficiently large compared to the wavelength, then the EM field will be evenly distributed at any point within the system. Therefore, the mean EM environment can be viewed as pseudohomogeneous, and this system can be assumed to behave like a pseudo-mode stirred reverberation chamber (MSRC). Much research on the validation [5] and applicability [6–9] of this method has been conducted in the literature. In particular, in [9], electromagnetic wave analysis was performed in a real large structure, and shielding effectiveness (SE) was derived and compared with the measured results.
In this paper, transmitting and receiving systems were installed and measured for a structurally simple rectangular parallelepiped shield room. For the cross check, the actual measurement environment was designed and analyzed using Wireless Insite, a commercially available simulation tool. In addition, the EM wave effect analysis in the shield room was carried out using a theoretical method, EMT/PWB method. Finally, the efficiency and accuracy of the theoretical method were verified by comparing the measurement, simulation, and theoretical method results. In Section II, we briefly introduce the theoretical methods, applying the theoretical method to the actual environment. In Section III, the target shield room is described, and the transmitting/receiving systems are elucidated in detail. Then, we introduce the simulation tool that models the measurement environment and then derive the analysis results.
II. Theoretical Methods
A system’s response at high frequencies is largely influenced by various variables, and it is unclear which components have dominant influences as well as the degree to which other components are influenced. Therefore, a probabilistic analysis model is preferred for a high frequency response, and the probabilistic methods used in this paper are introduced. To verify the validity and accuracy of these methods, the high frequency response of the shield room is analyzed as shown in Fig. 1.

1. Electromagnetic Topology
The main concept of EMT, defined by Baum [2], is to divide all spaces of complex electromagnetic problems into energy levels, including the space of interest [3]. This concept can be very useful in complex modern systems, because the complex EM interactions that occur inside the system can be simply expressed as topological diagrams.
2. Power Balance Method
The PWB method [4, 6, 7] is a probabilistic approach to EM interference phenomena in complex large systems. This method is based on the assumption that the EM field inside an electrically large system acts as a random variable, as in a mode-stirring reverberation chamber (MSRC).
As shown in [6, 7], the mean dissipated power in the cavity was calculated as the superposition of the mean power density obtained through the mean coupling cross-section (MCCS) of all the dissipated mechanisms existing in the cavity, expressed as Eq. (1). Also, it can be seen from Eq. (2) that the MCCS of the loss mechanism in the cavity is inversely related to the quality factor (Q),
where Pd is the sum of all dissipated powers in the cavity, <σ> is the mean coupling cross-section inside the cavity, Sincident is the power density incident in the cavity, V is the volume of the cavity, and <σi > is the MCCS of the individual losses.
To calculate the mean coupling cross-section, first, the loss factors inside the cavity must be defined, and the coupling cross-section of each element should be determined. In this paper, since the target is a shield room, only the losses due to the wall and aperture as well as each coupling cross-section could be calculated by Eq. (3) and (4) [10], where aap is the radius of the aperture, c is the speed of light, S is the surface of the shield room, μ0 and μr are the vacuum permeability and effective permeability, respectively and σ is the electrical conductivity of the wall.
As shown in Fig. 2, the topological diagram was expressed considering the loss mechanisms of the shield room and EM interference path. The nodes correspond to the free space and interior of the shield room in which the loss occurs, and the aperture and metal wall correspond to the loss elements. The propagation path is represented by the arrows. To model the signal input into the actual shield room, the input signal model using a directional antenna expressed by Eq. (5) was used, where Pr is the received power, Pt is the transmitted power, Gt is the gain of the transmitting antenna, Gr is the gain of the receiving antenna, and R is the distance between the transmitter and receiver.
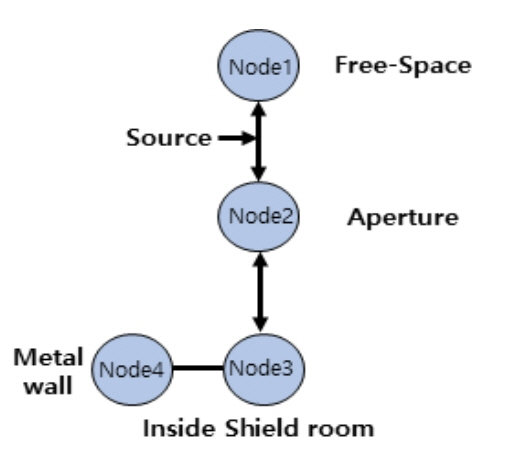
Topological diagram of the shield room.
III. Measurement and Simulation
1. Measurement Set-Ups
In this paper, the aim was to efficiently perform EM wave analysis on the shield room as shown in Fig. 3. As shown in Fig. 1, the the size of the which was 3 m×2.5 m×2.5 m, and the material of which was metal (Fig. 2). On the front of the shield room, there was an aperture of 0.2 m×0.57 m on the front of the shield room. To verify the EMT and PWB method, the shield room was placed in a semi-anechoic chamber. The target frequency was in the range of 0.6 GHz to 6 GHz, and the transmitted power was constant at 18 dBm. Measurements were performed in two manners, all of which use the same transmitting/receiving systems. The distance between the transmitting/receiving antennas was constant at 4.5 m. Details of the transmitting/receiving systems are shown in Table 1.
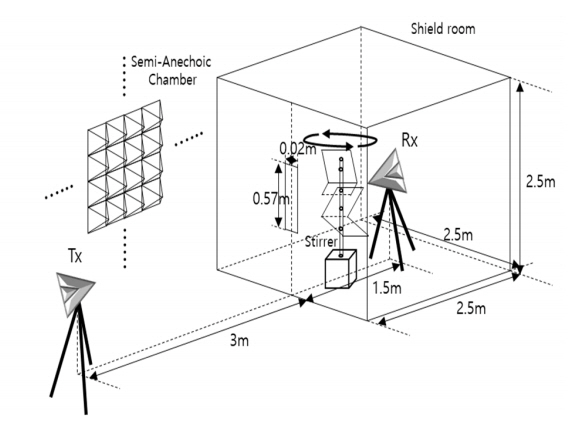
Overview of the measurement.
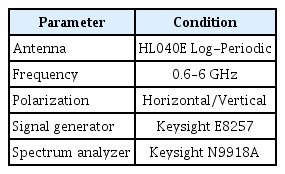
Information for the employed transmitter/receiver
The first measurement method (Step 1) was performed as shown in Fig. 4(a). In the case of this measurement method, it was performed to check and record the level of the referenced received power. An absorber was installed at the bottom between the transmitter and receiver to measure the line-of-sight (LoS) signal strength.
The second measurement method (Step 2) was to maintain the same transmit/receive system and position, as in the first case, and install the shield room and a stirrer as shown in Fig. 4(b). The stirrer was used to control the condition of the environment inside the shield room in which the measurement was performed in accordance with the PWB method. During this measurement, the stirrer rotates at a constant speed, and the receiving antenna is installed facing the transmitting antenna. If the stirrer works properly, the EM waves propagated into the shield room are uniformly distributed in the shield room. The receiving system measures 20 samples per frequency and stores them in the computer.

Measurement steps: (a) Step 1 (line-of-sight) and (b) Step 2.
Fig. 5(a) shows the measurement results of the LoS, and Fig. 5(b) and (c) show the results of the same polarization (Co-Pol.) and cross-polarization (Cross-Pol.) inside the target. As shown in Fig. 5(a), the results of the same polarization and cross-polarization exhibited a difference of about 15 dB for all frequencies. However, the measured result after installing the shield room and the stirrer revealed different tendencies according to the frequency. As shown in Fig. 2(a), the aperture of the shield room was long and narrow. Therefore, the V-polarization wave exhibited a lower received power than the H-polarized wave in the relatively low frequency regions in which the length of the wavelength was longer than the aperture size. This was due to the shape of the aperture; however, in the relatively high frequency region, the wavelength was not electrically influenced by the shape of the aperture, because it was electrically sufficiently shorter than the aperture. Therefore, the results of all the polarizations were similar, as shown in Fig. 5(b) and (c), in the high frequency region.
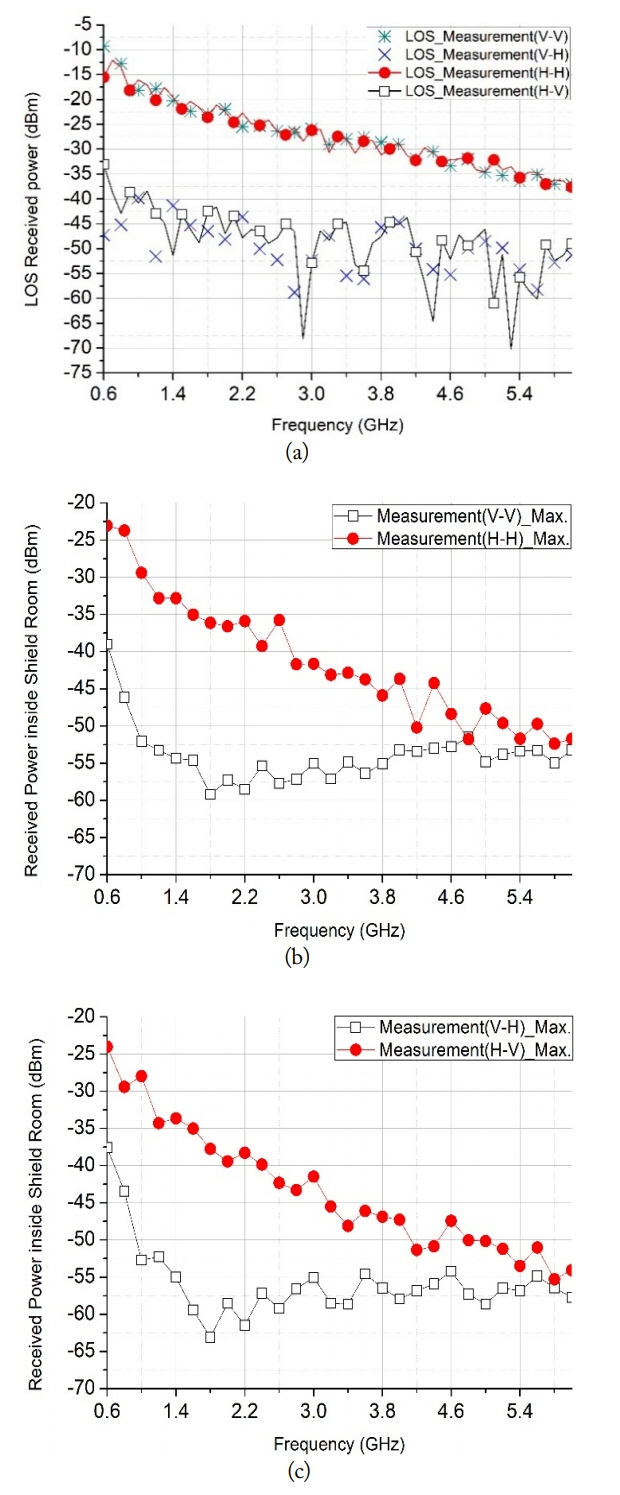
Measurement results: (a) line-of-sight result, (b) Co-Pol. result, and (c) Cross-Pol. result.
2. Simulation
For this research, we used Wireless Insite as a commercially available simulation tool, which predicts the effects of building and terrain on EM wave propagation and evaluates the impact of the position of the transmitter and receiver in the target area on signal strength. It is known that Wireless Insite generally models the irregular terrain and physical properties of urban buildings, performs EM calculations, and then evaluates signal propagation characteristics. The calculations are performed in a manner that emits rays at the transmitter and propagates through the target’s shape. These rays interact with the geometric features and are directed to the receiver position. Ray inter actions include multiple reflections of the modeled surface, diffraction around the edge of the structure, and transmission through the surface. At each receiver position, the contribution of the arriving light path is combined to determine the EM field strength, path loss, delay spread, arrival direction, and impulse response [12].
As shown in Fig. 6, the shield room is modeled using the commercially available simulation tool, and the receiver and transmitter are defined. The transmitting and receiving antennas set up in the simulation are modeled using information such as radiation pattern, VSWR (voltage standing wave ratio), and gain, which are the antenna information used for the actual measurement. As physical phenomena of radio-wave propagation, 20 reflections and three diffractions were counted to derive an efficient simulation result. The major difference between measurement and simulation modeling is the presence or absence of a stirrer. In this simulation tool, since the stirrer could not be modeled as with the measurements, additional points were added to the inside of the shield to produce a similar effect as the stirrer. All receivers obtained the simulation results from four directions (0°, 90°, 180°, 270°) per frequency based on the transmitter and calculated average received powers in four directions. The received powers are used as representative values in the shield room. Also, as shown in Fig. 6(b), in order to determine the influence of the position of the receiver located inside the shield room, the receiver was placed at intervals of 0.3 m in order to select three different measurement regions. The three measurement areas were 2.4 m × 1.9 m × 1.9 m (Stage 1), 2 m × 1.5 m × 1.5 m (Stage 2), 1.6 m × 0.9 m × 0.9 m (Stage 3), respectively. The results of all stages are showed in Fig 7. In the results, the influence of the position of the receiver inside the shield room was small and negligible.
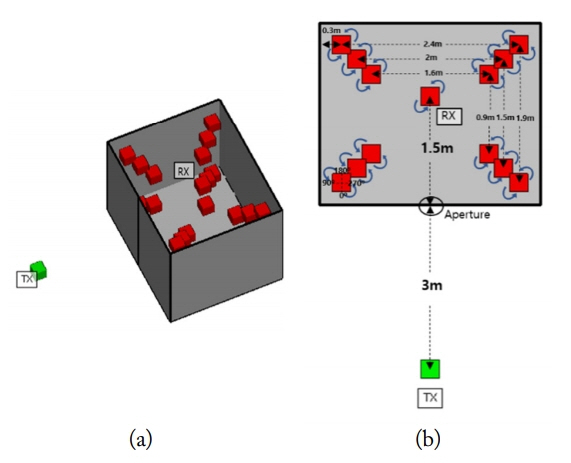
Geometry of shield room using Wireless Insite model: (a) 3D-model and (B) 2D-model and dimension.

Received powers inside the shield room calculated by Wireless Insite.
IV. Results
In Fig. 8, the received powers obtained from the measurement, the simulation, and the theoretical method are compared. Fig. 8(a) compares the measurement results of Step 1 with the results of the simulation tool and theoretical method. All three results show a similar tendency. Therefore, it can be seen that the signal model used for the input signal of the theoretical method and the parameter set in the simulation tool reliably reconstructed the measurement environment. Fig. 8(b) compares the measured and calculated received power inside the shield room. The PWB method is based on an assumption that the environment is similar to the environment of the reverberant room because the mode increases exponentially in an electrically large structure compared to the target wavelength. The results shown in Fig. 8(b) reliably show the condition of the EMT/PWB method. The wavelength of the low frequency region is not sufficiently small compared to the size of the aperture and shield room. Therefore, results in low frequency regions do not provide accurate results, since they are inconsistent with the condition of the EMT/PWB method. In contrast, the shorter the wavelength near the high frequency region, the more the environment to the condition of the PWB method. Therefore, it is predictable that all results in the high frequency region showed similar trends. It should be noted that it takes a considerable amount of time to derive the results from Wireless Insite when compared to the PWB method, as this simulation tool does not provide a frequency sweep function. Also, it does not have the function to replace the stirrer. Therefore, it is necessary to derive the results for rotating the receiving antenna in four directions (0°, 90°,180°,270°) to obtain the effect of the stirrer. As the structure of the target is complex and electrically large, the calculation time increases, and these drawbacks increase the computation time of the simulation tool. In contrast, the algorithm of the PWB method consists of relatively simple linear combinations, and since the target is complex and electrically larger, the approach becomes closer to creating an environment in which this method can be applied well. Therefore, the PWB method can reduce computation time and increase accuracy despite the target being complex and electrically large. In fact, it takes about 6 hours to obtain results using Wireless Insite but only about 1 second using the PWB method.

Comparison of the results of the measurement, the simulation and the theoretical method: (a) line-of-sight (LoS) and (b) received power inside shield room.
V. Conclusion
In this paper, an efficient EM wave analysis study was carried out in a shielded room using a theoretical method. This theoretical method represented the topology diagram of the enclosure using the EMT method as well as the results of EM analysis inside the enclosure using the PWB method. In order to verify the accuracy and validity of the theoretical method, we performed the measurements in the shield room, and modeled the actual measurement environment using the commercially available simulation tool, Wireless Insite, and derived the results. Finally, the results of the theoretical method were compared with other results. In comparing the results, the theoretical method was found less accurate in the low frequency range but more accurate in the high frequency region, the reason for which was that, in the high frequency region, it satisfied the condition of the theoretical method that the length of the wavelength should be electrically much shorter than the shield room. In addition, the results from the commercially available simulation tool were similar to the measurement results but had clear limitations such as the large amount of data and consumption time as the target becomes more complicated and larger. On the other hand, the theoretical method has the advantages of using small amounts of data and computer resources, such as memory and consumption time. Therefore, the proposed theoretical method is capable of efficient EM wave analysis for electrically large and complex structures.
Acknowledgments
This work was supported by the Electronics and Telecommunications Research Institute (ETRI) grant, funded by the Korean government (No. 2017-0-00982, Development of System-level Technology for Protection Design and Performance Evaluation against EMP). If you intend to utilize the contents of this report, you must disclose that the research was funded by the ETRI.
References
Biography

Han-Hee Lee received his B.S. degree in electronic engineering and information engineering from Korea Aerospace University (KAU), Goyang, Korea in 2018. He is currently working toward his M.S. degree at the Microwave and Millimeter-wave Solution Laboratory (MMSL) at Korea Aerospace University. His main research interest is electromagnetic interference (EMI) or electromagnetic compatibility (EMC) analysis of system levels, as well as spaceborne SAR system and SAR signal processing.

Jong Hwa Kwon received the B.S. degree in electronics engineering and the M.S. degree in radio science and engineering from Chungnam National University, Daejeon, Korea, in 1994 and 1999, respectively. He received his Ph.D. degree in electrical and electronic engineering from Yonsei University, Seoul, Korea, in 2010. He is currently a Principal Researcher and Section Director in the Electromagnetic Environment Research Section of the Electronics and Telecommunications Research Institute, Daejeon, Korea. His current research interests include EMC measurement, the areas of theoretical/numerical electromagnetic analysis, signal/power integrity, metamaterials including the electromagnetic bandgap, and human exposure to RF fields.

Jae Wook Lee received his B.S. degree in electronic engineering from Hanyang University, Seoul, Korea in 1992 and his M.S. and Ph.D. degrees in electrical engineering with a specialization in electromagnetics from the Korea Advanced Institute of Science and Technology, Daejeon, Korea, in 1994 and 1998, respectively. From 1998 to 2004, he was a senior member of the Advanced Radio Technology Department, Radio and Broadcasting Research Laboratory, Electronics and Telecommunications Research Institute, Daejeon. He was with the faculty of Korea Aerospace University (KAU), Goyang, Korea. He is currently a professor at the School of Electronics and Information Engineering of KAU. His current research interests include high-power amplifier design, computational electromagnetics, electromagnetic interference/electromagnetic compatibility analysis of printed circuit boards, and satellite antennas and the spaceborne SAR system.

Jung-Hwan Hwang received his B.S. and M.S. degrees in electronic engineering from Chungnam National University, Daejeon in 1998 and 2000, respectively, and the Ph.D. degree in information and communication engineering from the Korea Advanced Institute of Science and Technology, Daejeon in 2016. From 2000 to 2002, he was a Research Engineer with Knowledge-on Inc., Iksan, South Korea, at which he focused on the development of microwave circuits. Since 2002, he has been with the Electronics and Telecommunications Research Institute, Daejeon, where he is currently a Senior Engineer. He has been primarily involved in the radio channel modeling. His current research interests include electromagnetic compatibility, electromagnetic fields safety, and health effects.

Chang-Hee Hyoung received his B.S. degree and M.S. degree in electronic engineering from Kwangwoon University, Seoul, Korea in 1996 and 1998, respectively, and his Ph.D. degree in information and communication engineering from the Korea Advanced Institute of Science and Technology, Deajeon in 2013. Since 1999, he has been with the Electronics and Telecommunications Research Institute, Daejeon, Korea, at which he is currently a Principal Engineer with the Radio Environment and Monitoring Research Group. He has been primarily involved in the design and development of analog and RF circuits for wireless networks. His research interests include short range communication systems and energy harvesting system from electromagnetic fields.