Computer Imaging of Electromagnetic Environment in Air Space with Industrial Electromagnetic Field Sources in Conditions of Combined Influence of EM Radiation
Article information
Abstract
This article deals with the visualization of the intensity of the electromagnetic field in a production room with various electrical equipment. To assess the electromagnetic environment under the simultaneous influence of a set of electromagnetic field sources (radiation sources), a new approach is proposed, based on the formation of electromagnetic portraits and combined pictures of the electromagnetic radiation danger. Electromagnetic portraits and hazard pictures are obtained from the results of visual diagnostics of hazardous areas of external surfaces of radiation sources, a limited number of measurements at control points, and modeling of the electromagnetic field, taking into account the possibility of simultaneous influence and amplification of the resulting action of several radiation sources. The technical implementation of the proposed approach is provided by the developed intelligent system that allows real-time automation of the control of the electromagnetic environment and the formation of hazard patterns in the zones of exposure to electromagnetic radiation at various frequencies (up to 3 THz), taking into account the electromagnetic field overlay. A complex estimation of the hazard level is combined from the separate hazard of each electromagnetic field component the briefly described mathematical apparatus.
I. Introduction
Electromagnetic (EM) field sources (radiation sources) are becoming more widespread at industrial and municipal facilities. At the same time, their increasing impacts on biological objects, as well as on information technology equipment, including microprocessor-based devices, reinforce the importance of EM wave propagation research [1].
The existing methods of studying EM waves [2–5], including the previously developed method with the participation of this article’s authors [6, 7], are based on the control of several standardized parameters of the electric, magnetic, and EM fields and do not allow studying EM radiation in the entire measurable EM field frequency range (up to 3 THz) in conditions of simultaneous influence of all EM field components. The modern monitoring techniques also do not involve the use of specialized equipment for visual diagnostics of hazardous areas of each radiation source’s external surface or its enclosing structure and/or building walls. They do not measure EM field parameters on secondary or external radiation sources within the limits of the studied space [2–7].
Existing monitoring and control systems [8–11] do not take into account the complex simultaneous effects of several EM field components on zones of influence and do not allow controlling the EM environment in a wide frequency range (up to 3 THz).
The analysis of this article’s authors shows that each frequency component of the EM field can be controlled separately with the help of modern measuring equipment [2, 9–12]. However, the assessment of the EM environment in the conditions of the combined influence of EM radiation up to 3 THz is a difficult task, which is proposed to be performed using hazard pictures (in the form of maps of the permissible time to be spent by a person in each of the various zones of the studied space).
As a result of visual diagnostics of dangerous zones of external surfaces of radiation sources (with a coating of dielectric materials), it is found [12] that the intensity of the components of the EM field in different zones of the surface depends on the degree of heating. Therefore, the EM field parameters in this case should be measured in areas of increased heating of the surfaces of radiation sources or their enclosing structures, as well as walls of buildings and of other structures. At the same time, for metal surfaces, the central zone should be considered an area of increased radiation intensity (regardless of the results of thermography), which must be taken into account to improve the accuracy of computer simulation.
Thus, the significance of the work lies in the principles of converting EM portraits (pictures of the distribution in space of the EM field components) [6] into pictures of the danger of EM radiation (in the form of maps of the allowed time to stay in an EM field) [7]. The transformation is performed on the basis of the results of the systematization of the methods for determining the permissible residence time in the zone of EM radiation, taking into account each component of the EM field. The next novelty is a new technology for constructing combined hazard pictures that consider the amplification of the joint action of several components of the EM field due to the superposition of the amplitude values of the controlled EM field parameters.
II. Theory
An intellectualized system (information-computational monitoring system with human participation and intellectual support for performing certain tasks) was developed, with the participation of this article’s authors, to solve the aforementioned problems. This system allows automatically modeling the EM environment and visualizing the danger of EM radiation in the entire measurable frequency range (up to 3 THz) in conditions of simultaneous influence of all EM field components. The intellectualized system consists of the following blocks:
A hardware block that is presented by a set of measuring devices (green rectangles in Fig. 1), including those developed by the authors;
A block of device adapters designed to connect the measurement instruments to a computer (blue rectangles in Fig. 1);
-
A computer with software (black rectangle in Fig. 1), including those developed by the authors’ programs, which, together with the hardware unit, allows performing arithmetic, logical, and other operations for the control and evaluation of the EM environment under conditions of separate and combined influence of EM field components in the frequency range of up to 50 MHz [12], including programs for
- computer simulation of the EM field indoors and outdoors (Fig. 2);
- automated identification of the characteristics of the superposition of alternating EM fields in the extended frequency range of up to 3 THz from different EM field sources under conditions of any variations in frequency, amplitude, and phase shift of individual EM waves;
- calculation of the allowed time to stay under the influence of electrostatic and alternating electric, magnetic, and EM fields;
- formation of pictures of EM danger in the form of maps of the allowed time to stay in each of the influence zones of several EM field sources of different frequency ranges;
- assessment of EM hazards in workplaces with electrical installations;
- integration of the EM field meter with other control and visualization system software products;
- determining the instantaneous values of the rated parameters of individual components of the EM field;
- automated selection of shielding materials to ensure EM safety under conditions of electrostatic and alternating electric, magnetic, and EM fields in a wide frequency range; and
- definition of additional parameters taken into account during EM monitoring in areas of influence of several EM field sources [12].
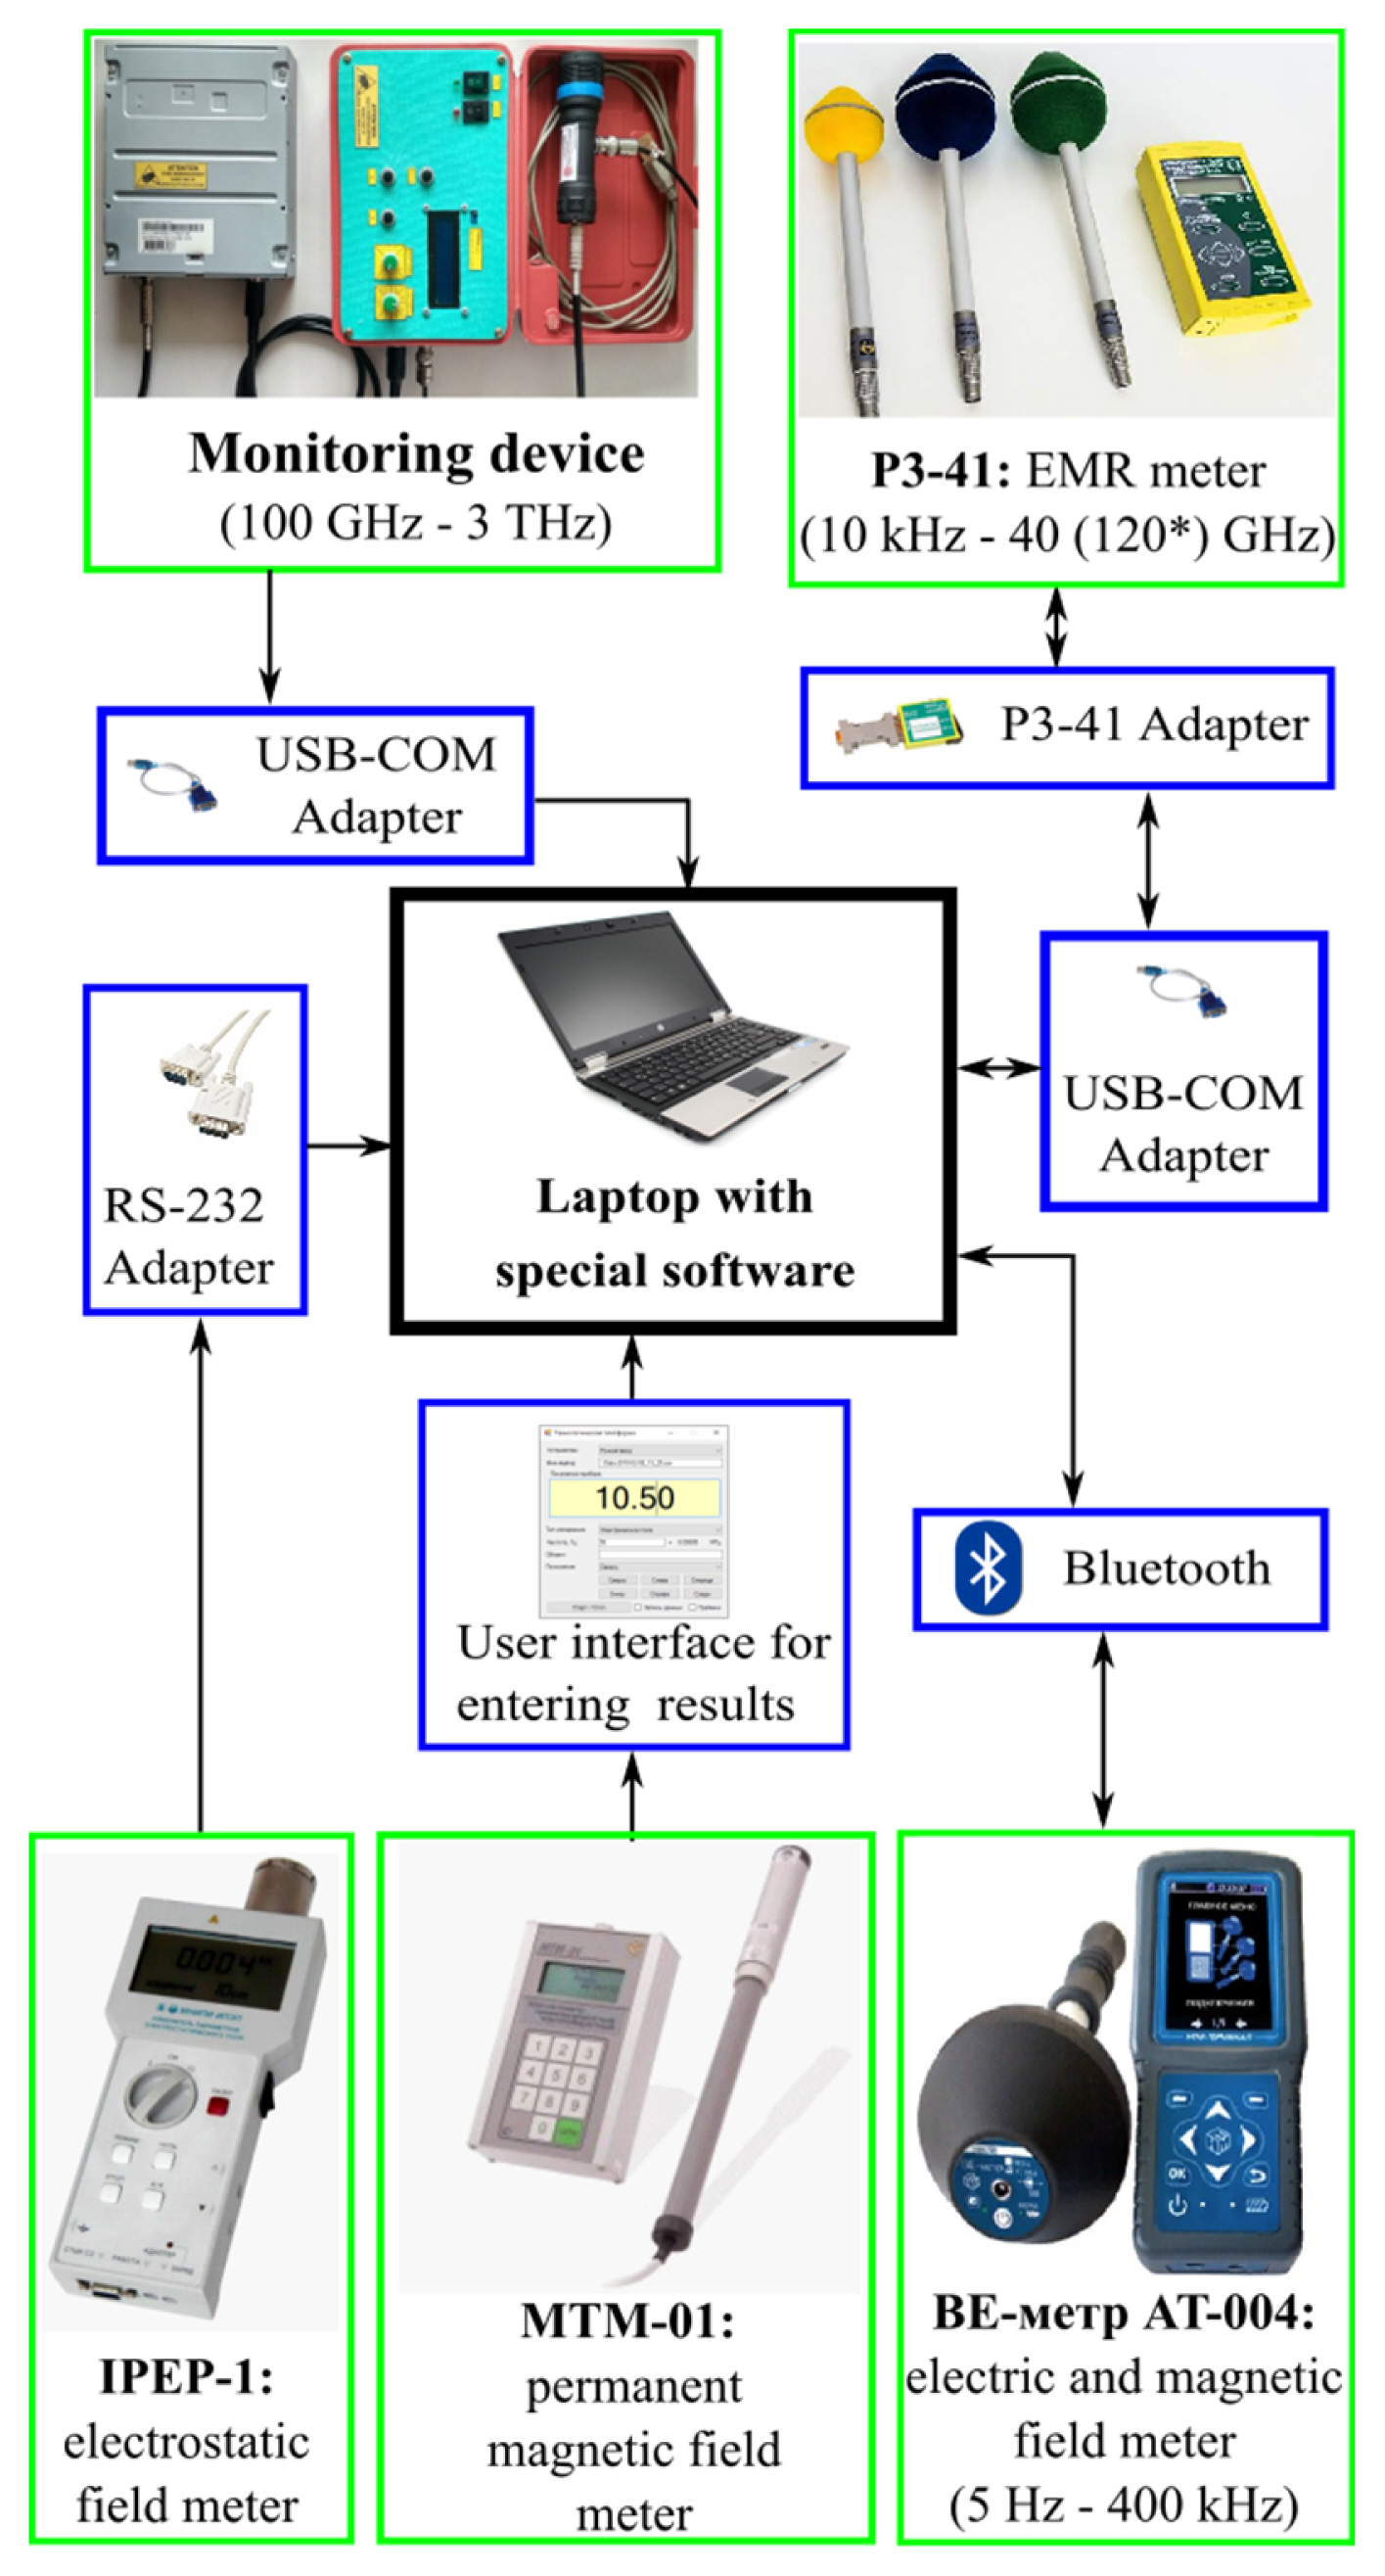
Block diagram of the main devices of the developed system used in conducting experimental studies.
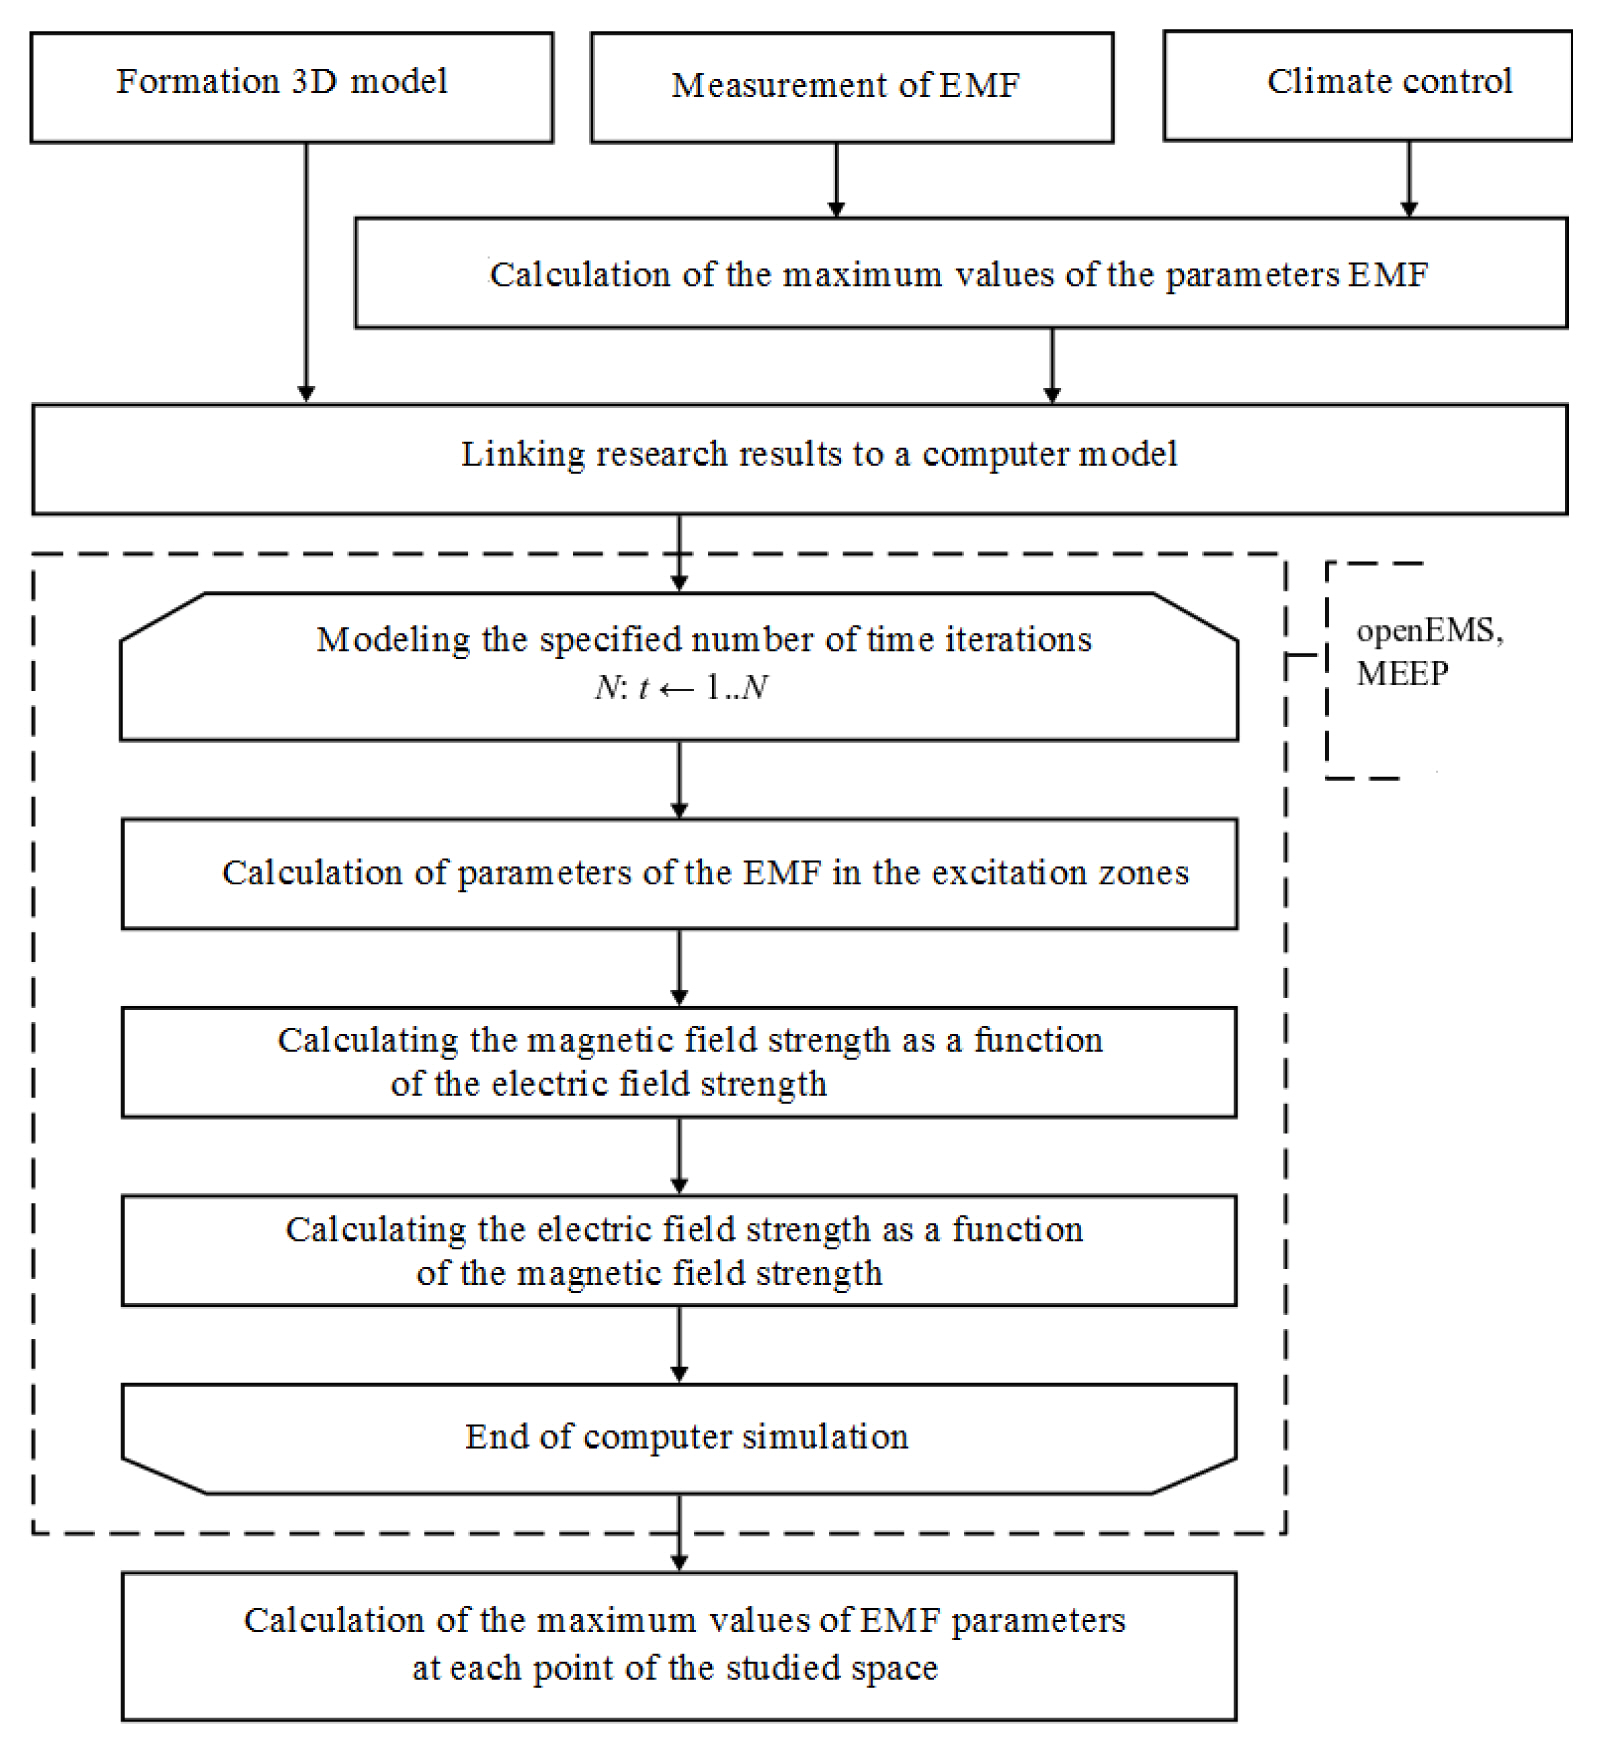
Flowchart of an electromagnetic environment modeling algorithm.
If a particular measurer has an adapter for computer connection, then it will send the data directly through the adapter. In the case of some older devices, no adapter is available, and the intellectualized system allows manual data input via the keyboard. It is also possible to convert any data already available, if required, into the simple format compatible with the system.
The computer saves the measured values into a separate database for every experiment. After a series of experiments, the data are processed using the developed software included in the intellectualized system. The 3D computer model of the studied room or area is created based on the spatial configuration of the radiation sources in the area. Every EM field source and communication line in the room should be registered as a solid metal object.
The EM environment monitoring technology has been considered by using an example of a production room of a greenhouse facility with a microclimate control system (climate control system) and an electric panel (Fig. 3). The climate control system is designed to monitor and control the temperature and humidity in the room with agricultural crops. The electric power distribution panel (electric panel) is used to distribute power among the individual components of the climate control system and to protect the electrical wiring against short circuits.

Appearance of the climate control system. “1” indicates electric panel and “2” climate control system.
III. Results and Discussion
By using the results of spectral diagnostics of the EM environment, the EM field parameters with high intensity (values greater than the permissible levels [13]) can be determined. To expand the frequency range, a device developed by the authors (see Fig. 1), allows exploring the spectral characteristics in the range of 100 GHz–3 THz.
The existing normative documents cover some frequencies (0 Hz–3 THz), so only the EM field parameters (the electrical and the magnetic field values and energy flow density) in this particular frequency range segment are measured.
Experimental studies were carried out at an ambient air temperature of 28°C and a relative humidity of 36% using the developed intellectualized system (Fig. 1). First, the background values of electric and magnetic fields in a wide frequency range (up to 50 MHz) were measured for each predetermined frequency component of the EM field. Next, at a regulated distance (10 cm) [13] from the climate control system and separately from the electric panel, the corresponding EM field parameter was measured three times at the boundary frequencies (50 Hz, 30 kHz, 3 MHz, 30 MHz, and 50 MHz); based on the results, its average value was calculated. Meanwhile, for each case, the standard distance should be determined according to local sanitary rules and norms.
The main data collected at this stage comprise the maximal value of every measured parameter for every accessible surface of every EM field source, including the most dangerous points [7, 12], which are selected according to the results of the primary thermal imaging research (this approach had not been previously implemented). Table 1 shows the results of measuring the electric field intensity E (V/m) from the climate control system and the electric panel.

Results of electric field intensity measurement
For every analyzed frequency, a computer spatial model should be prepared to create the EM portrait for this frequency. Fig. 4 shows the distribution in the studied space of the electric component of the EM field of industrial frequency (EM portrait of the electric field for a frequency of 50 Hz), which comprises the results of computer simulation. To obtain the EM portrait, the EM field is modeled using the finite-difference time-domain (FDTD) method [14–17], taking into account external and secondary radiation sources (using the results of experimental measurements).
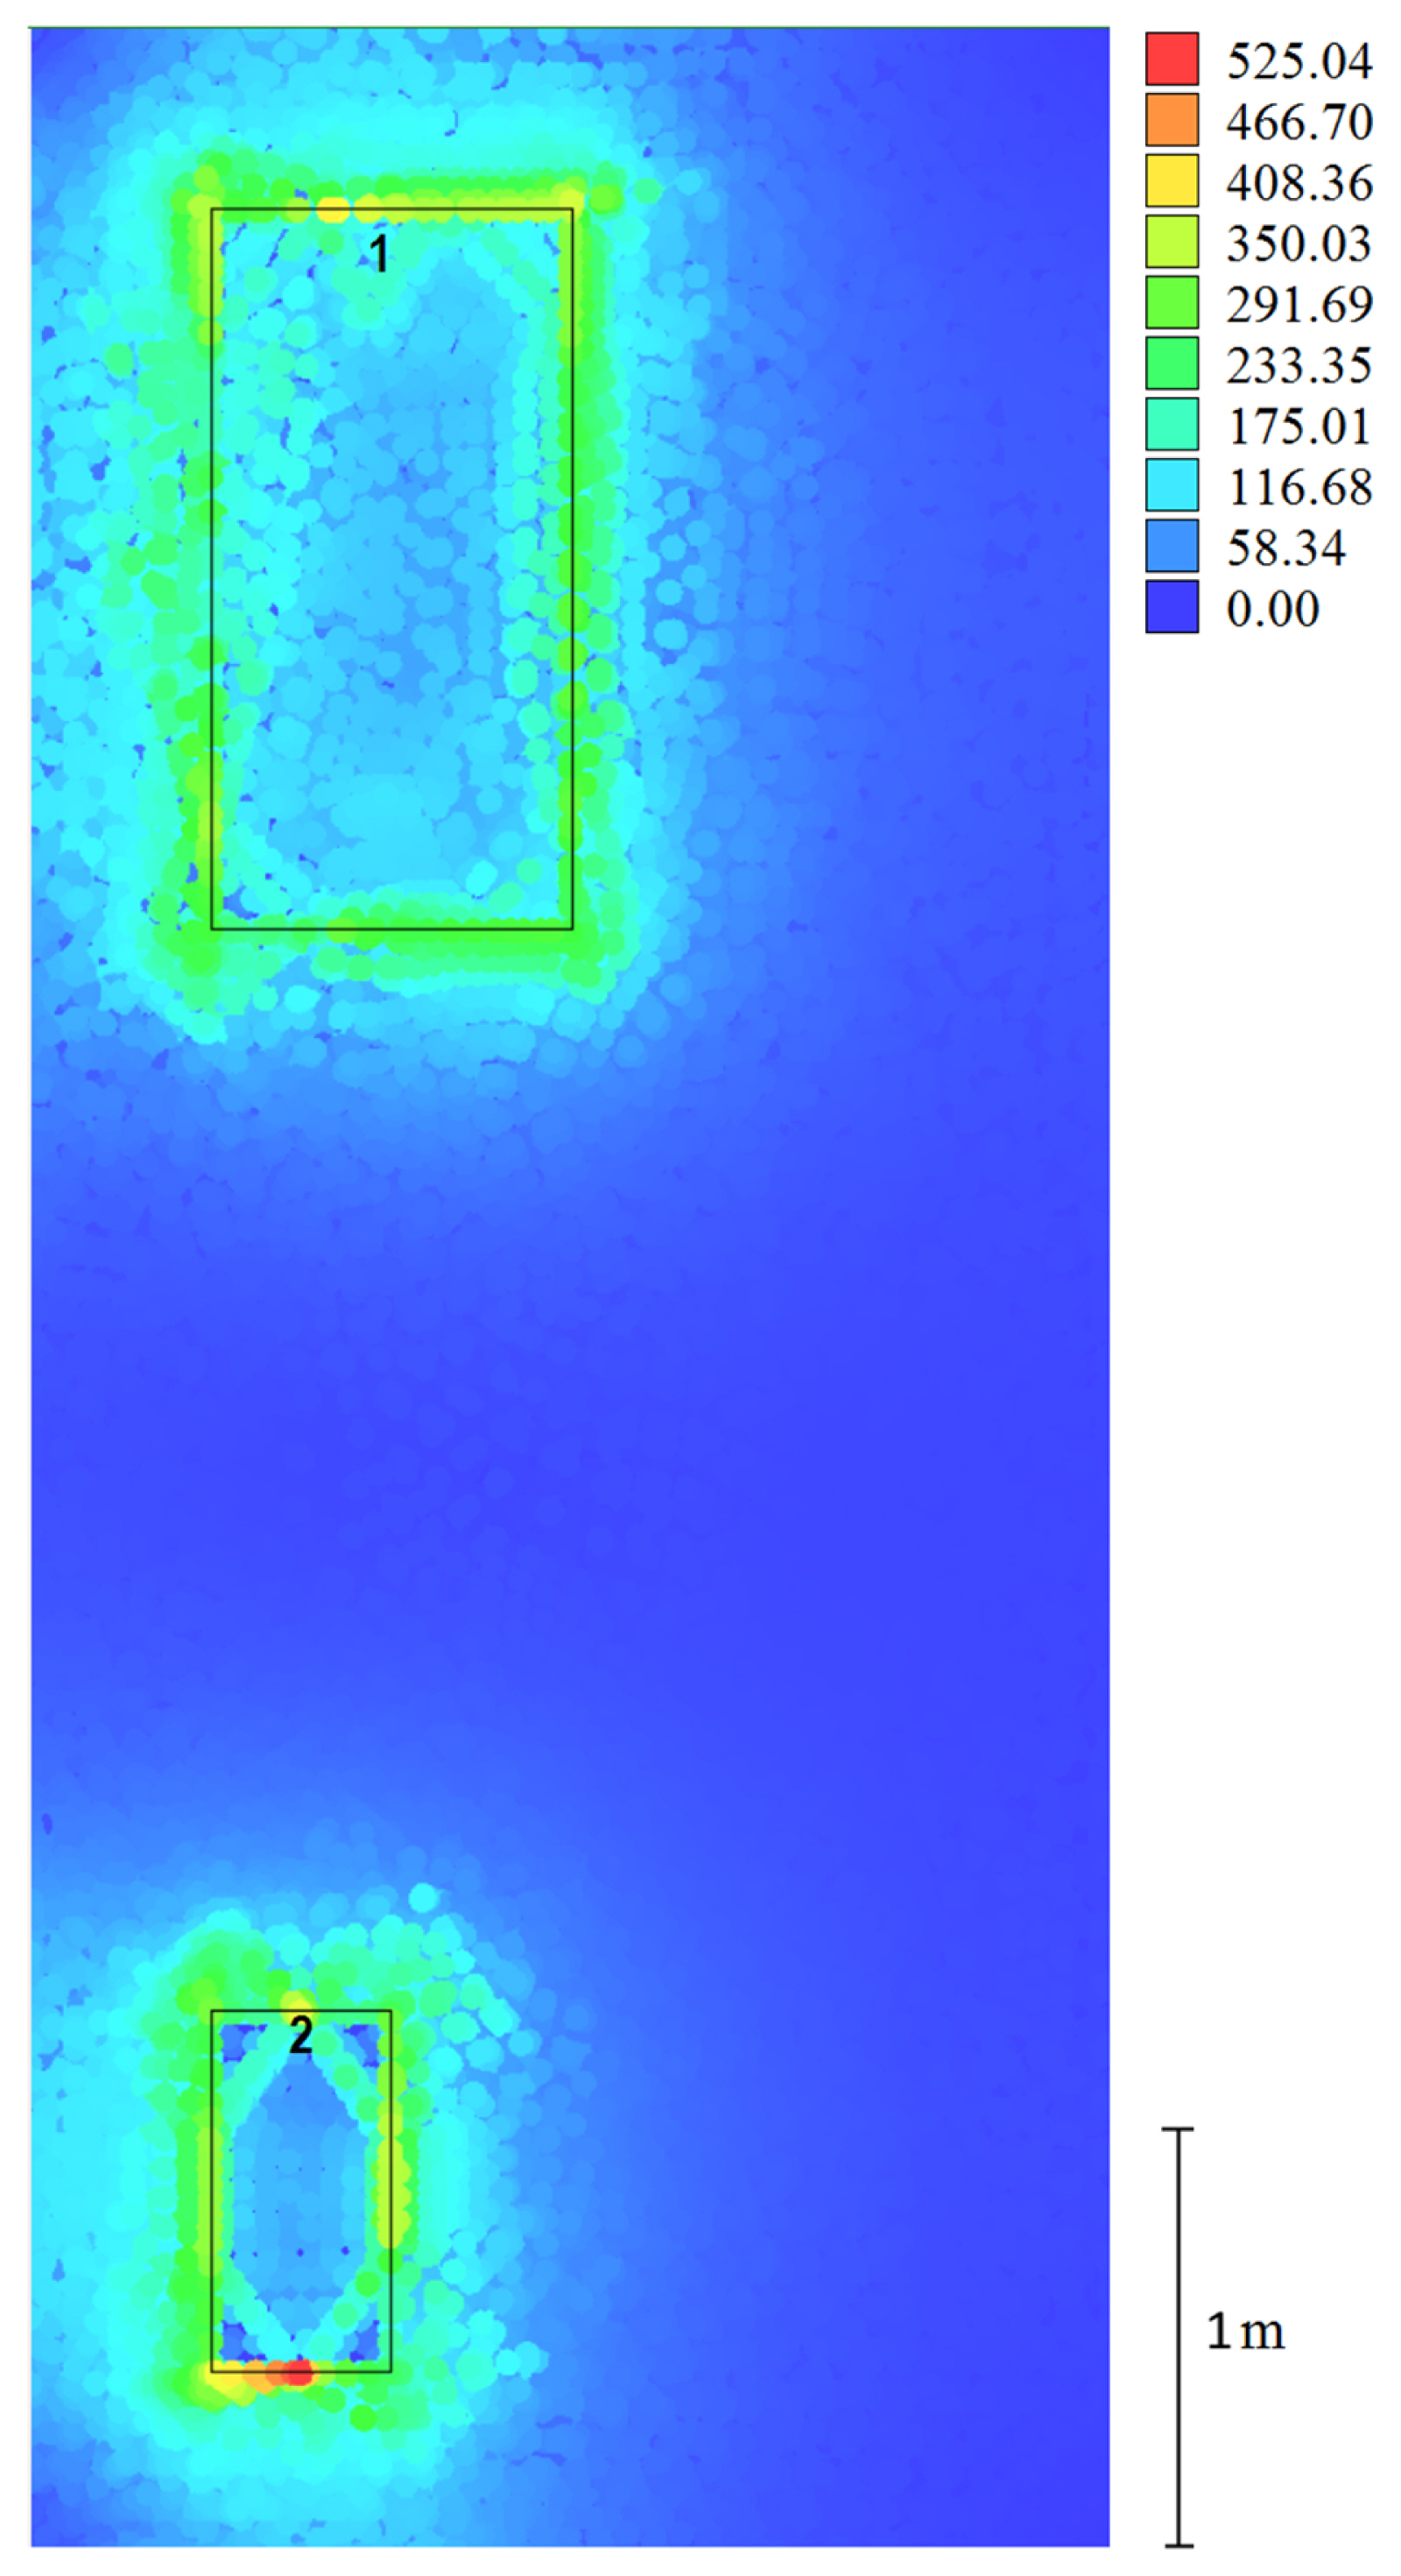
Electromagnetic portrait of the electric field (V/m) for a frequency of 50 Hz. “1” indicates climate control system and “2” electric panel.
The refined computational structure for the case with a one-dimensional space is shown in Fig. 5 [18]. The diagram shows that the values of the magnetic field strength (Hy) at time t are calculated based on the values of the electric field strength (Ez) at time t – 1/2 in adjacent space cells. In turn, the values of the electric field strength (Ez) at time t + 1/2 are calculated based on the values of the magnetic field strength (Hy) in adjacent space cells at time t (in this case, adjacent cells are those whose coordinates are separated by a half-integer number of cells). The calculations continue in the same way as presented in the diagram (Fig. 5). The calculation for the three-dimensional case is based on the same principle [15–18].
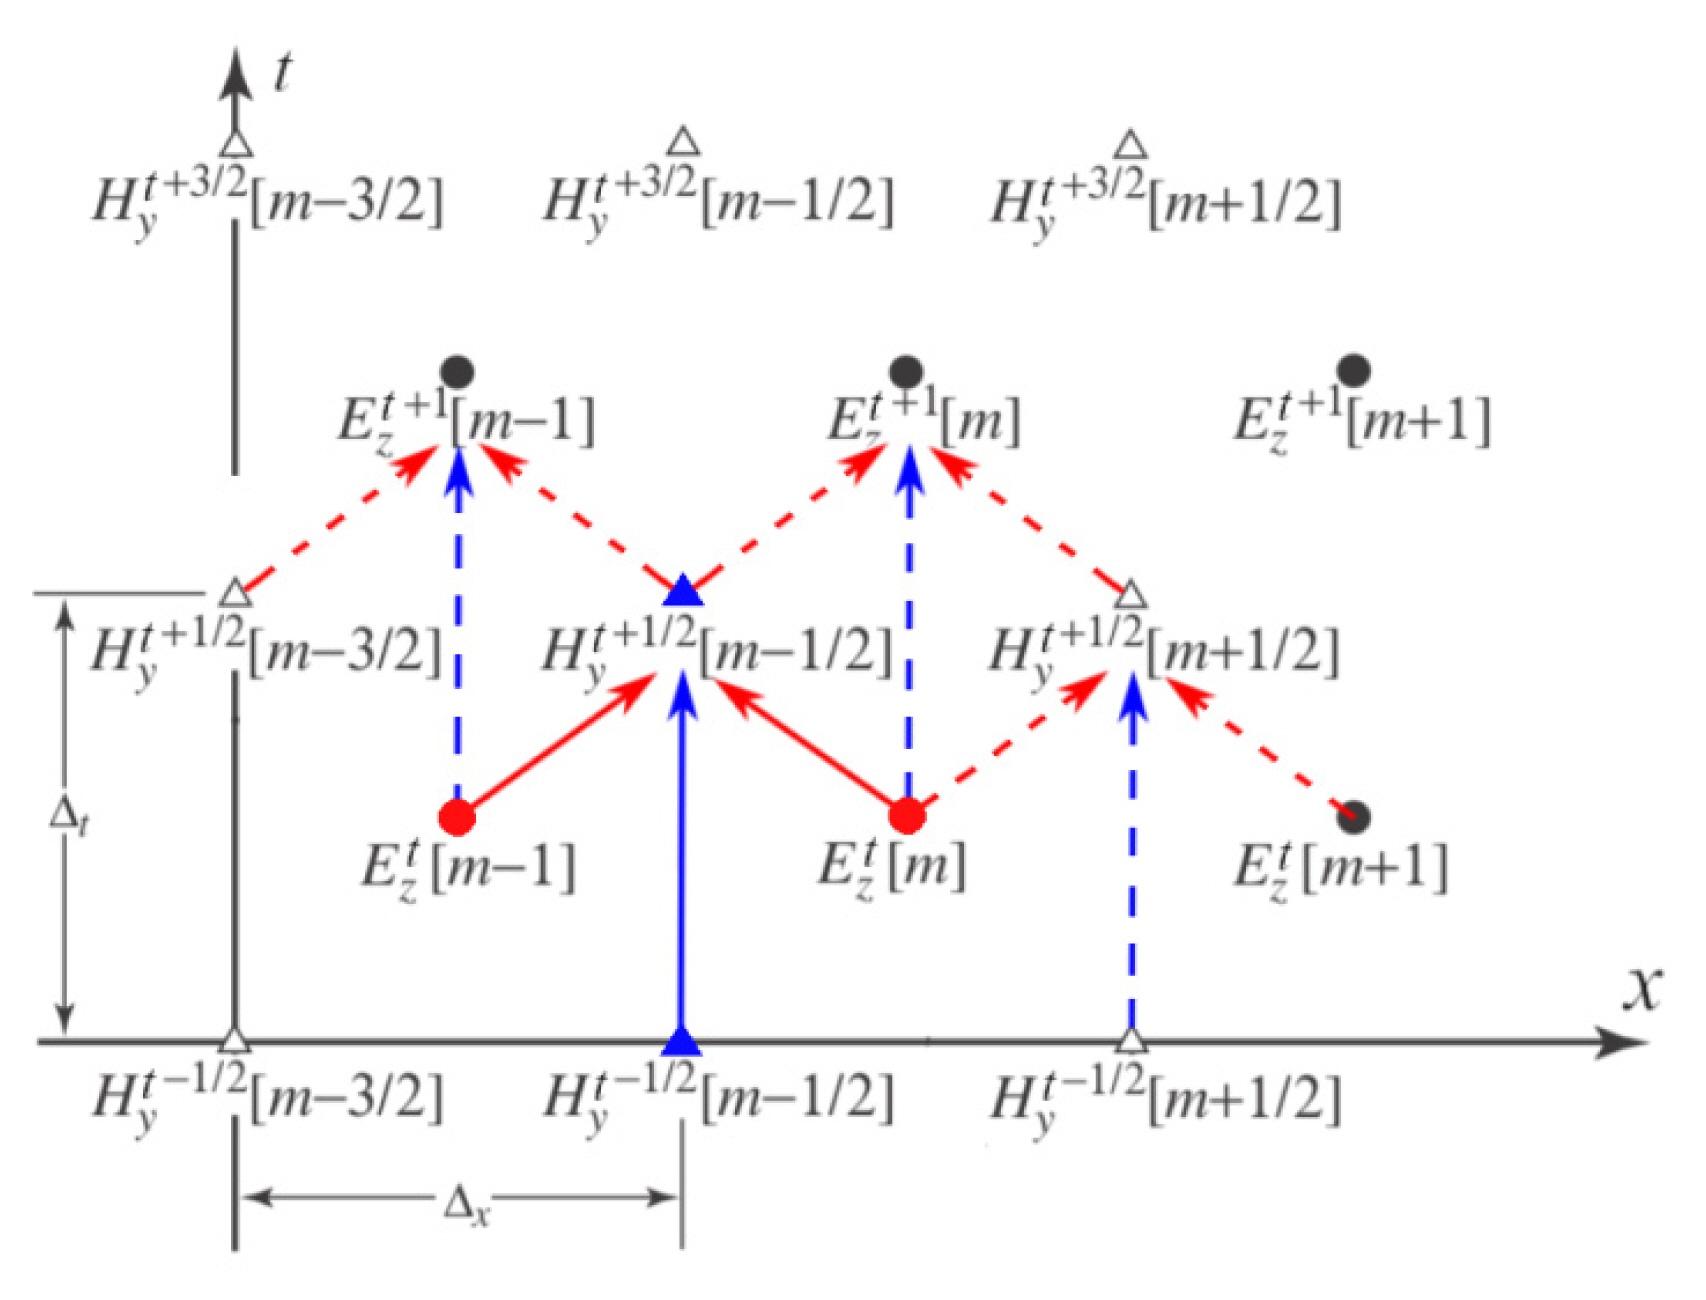
Space-time scheme for calculating electric and magnetic fields’ strengths in one-dimensional space (red vector = electric field strength, blue vector = magnetic field strength).
All the EM portraits generated at the previous stage are used to prepare the EM environment hazard maps. The intellectualized system achieves this by transforming the EM parameter axis (e.g., electric field, magnetic field, energy flow density) into the allowed time to stay (determined according to the local sanitary norms) axis in every image node (i.e., a pixel).
When estimating the EM field hazard inside the industrial facilities, a cylindrical EM radiation hazard map (see Fig. 6) may be used, modeled in accordance with the technology developed by the authors [6, 7]. Every pixel of the cylindrical image accounts for the parameters of the EM field inside the cylindrical zone (with some predetermined radius based on the industrial requirements) around the pixel. It helps to carefully consider the working zones of the personnel inside the industrial room.
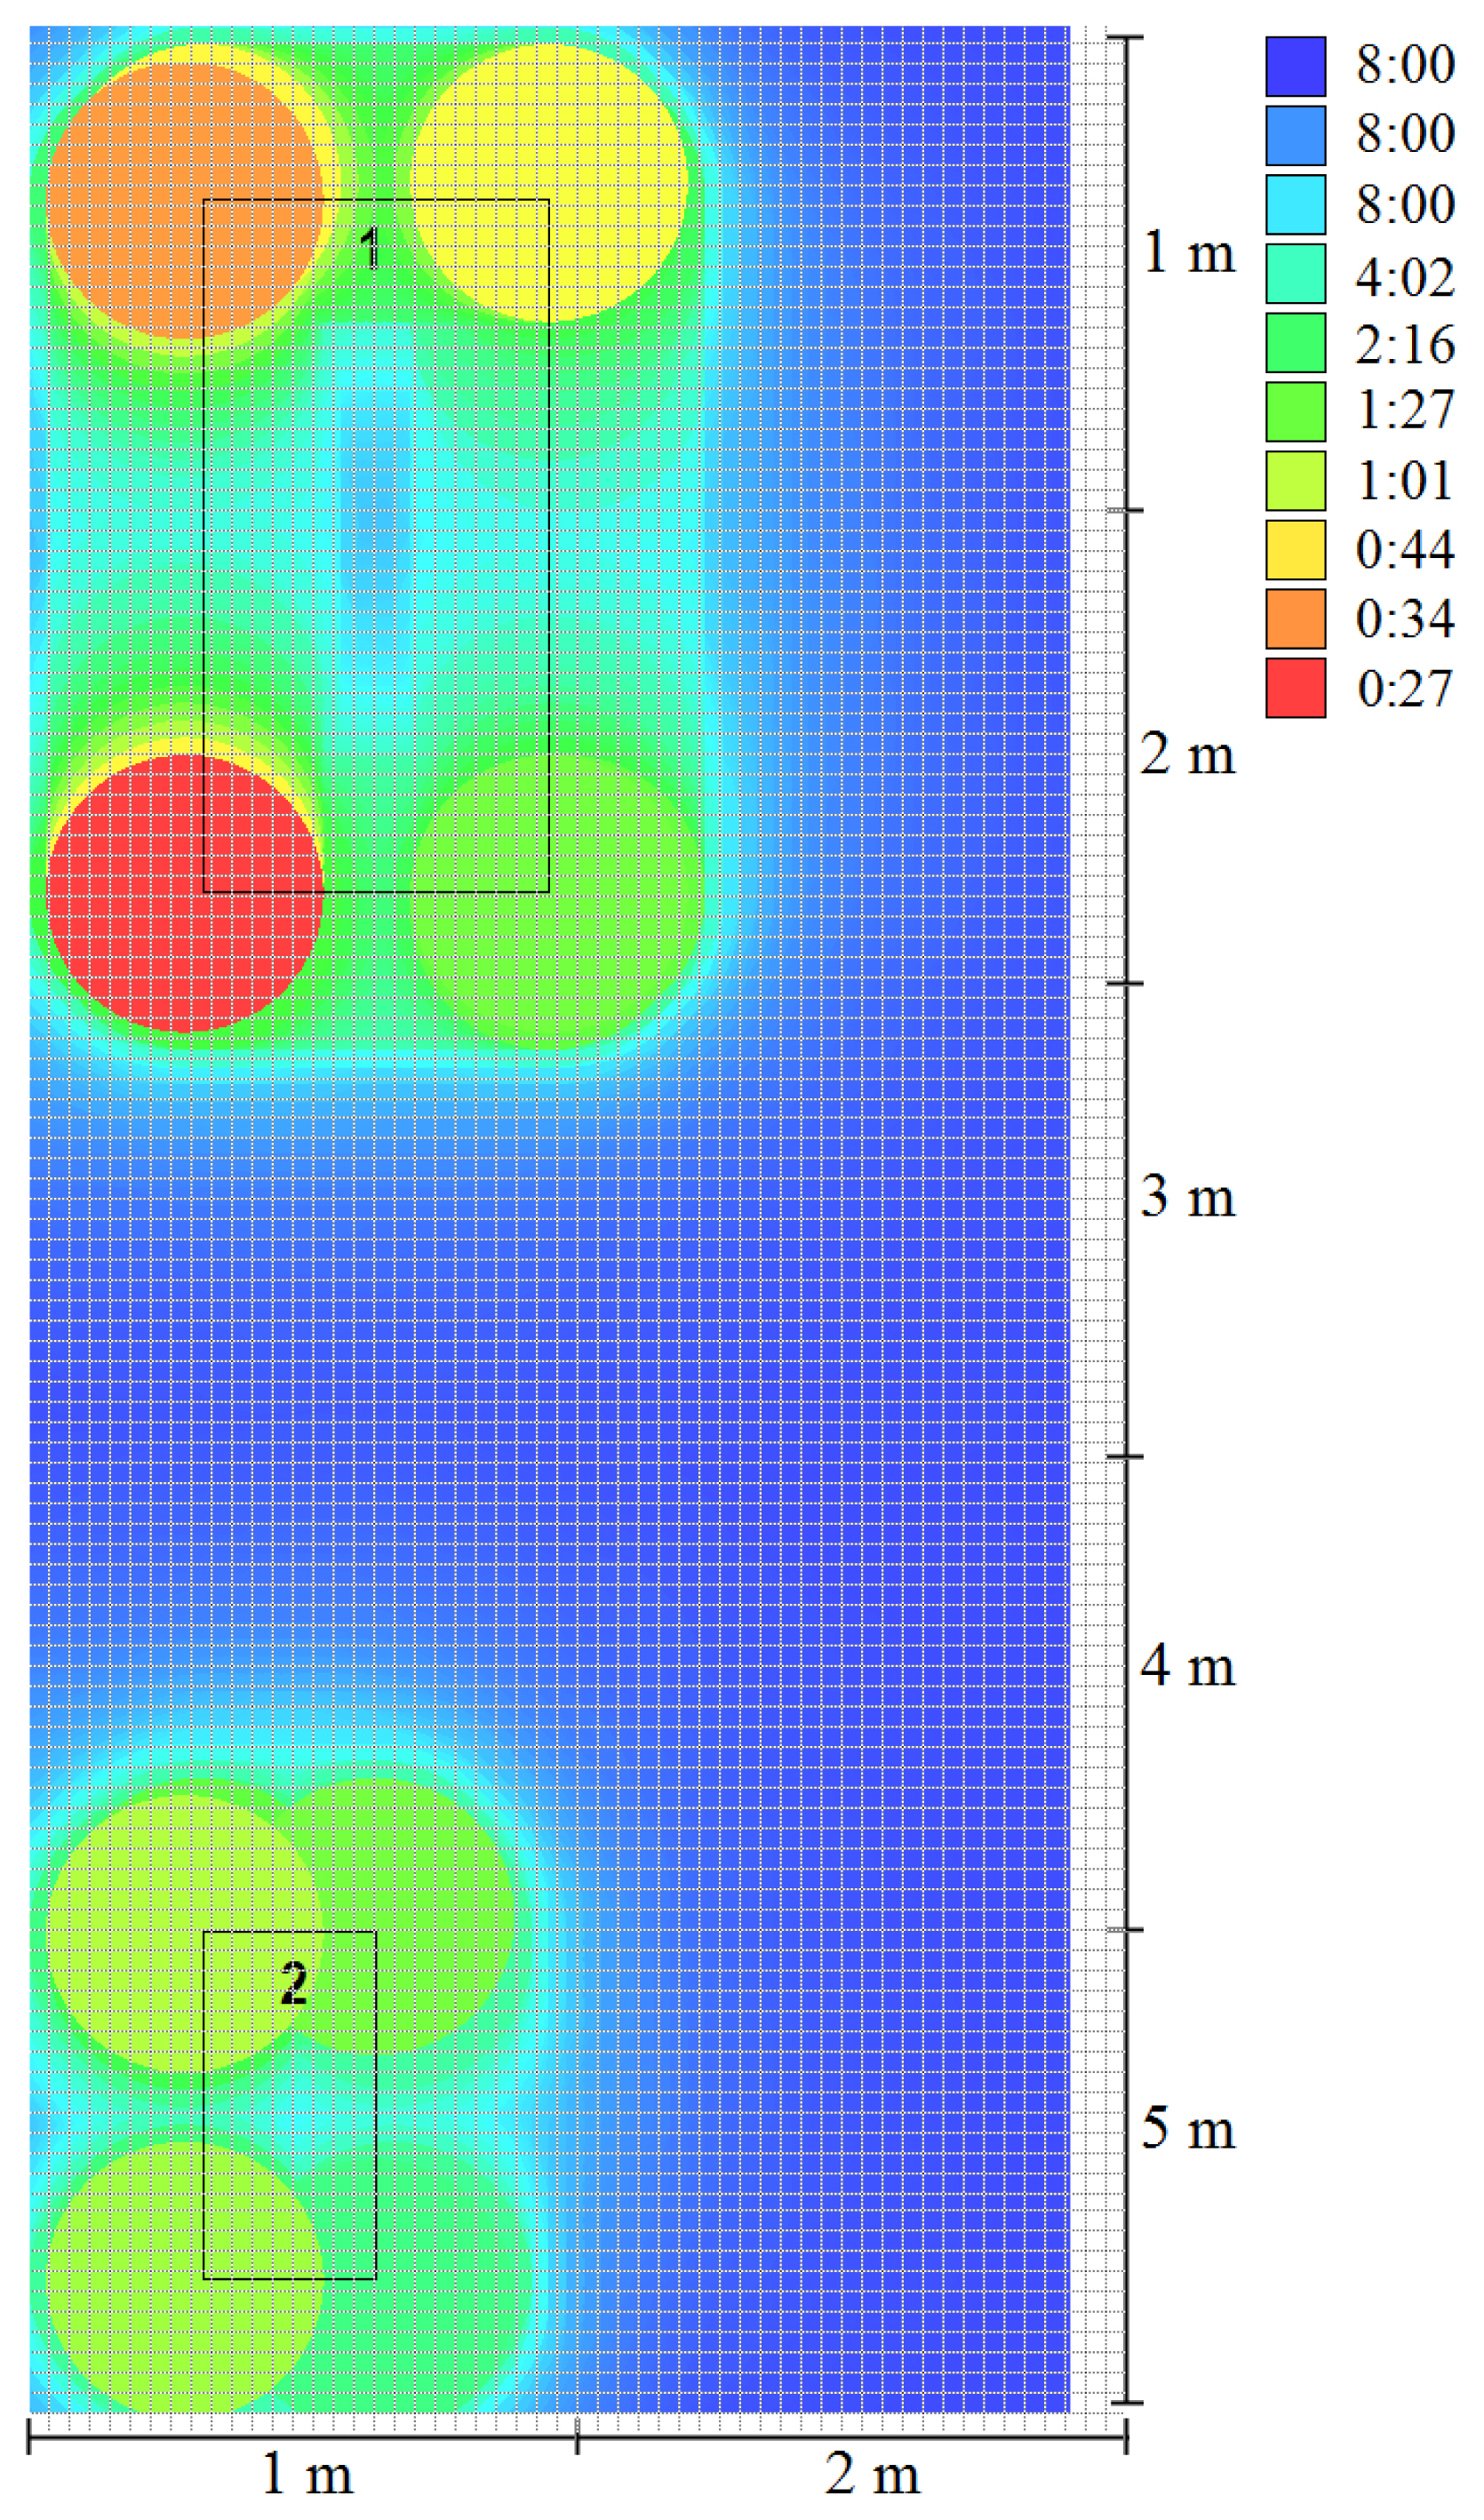
Cylindrical EM radiation hazard map (hours of allowed time to stay) for the electric field (30 kHz). “1” indicates climate control system and “2” electric panel.
The areas of space where multiple danger zones overlap (e.g., if there are EM field sources acting on multiple frequencies) may be processed based on the analysis of the hazard map. In this case, overlapping influence refers to the combined simultaneous effect of EM waves with several frequencies, which leads to the so-called superposition of the amplitude values of the frequency components of the EM field. A complex case analysis, when various radiation sources operate on different frequencies with overlapping hazard zones, is a complicated task that can have multiple solutions.
One possible solution that allows achieving the objective of creating an EM radiation hazard map is overlay modeling. The combined-point EM radiation hazard map (see Fig. 7) allows visually identifying the most hazardous zones of the space under study. The resulting model demonstrates a growth in the EM radiation intensity under the influence of various EM field sources and frequency ranges. The model is based on direct overlaying of zones, created by various radiation sources using Eq. (1), as proposed by the authors.
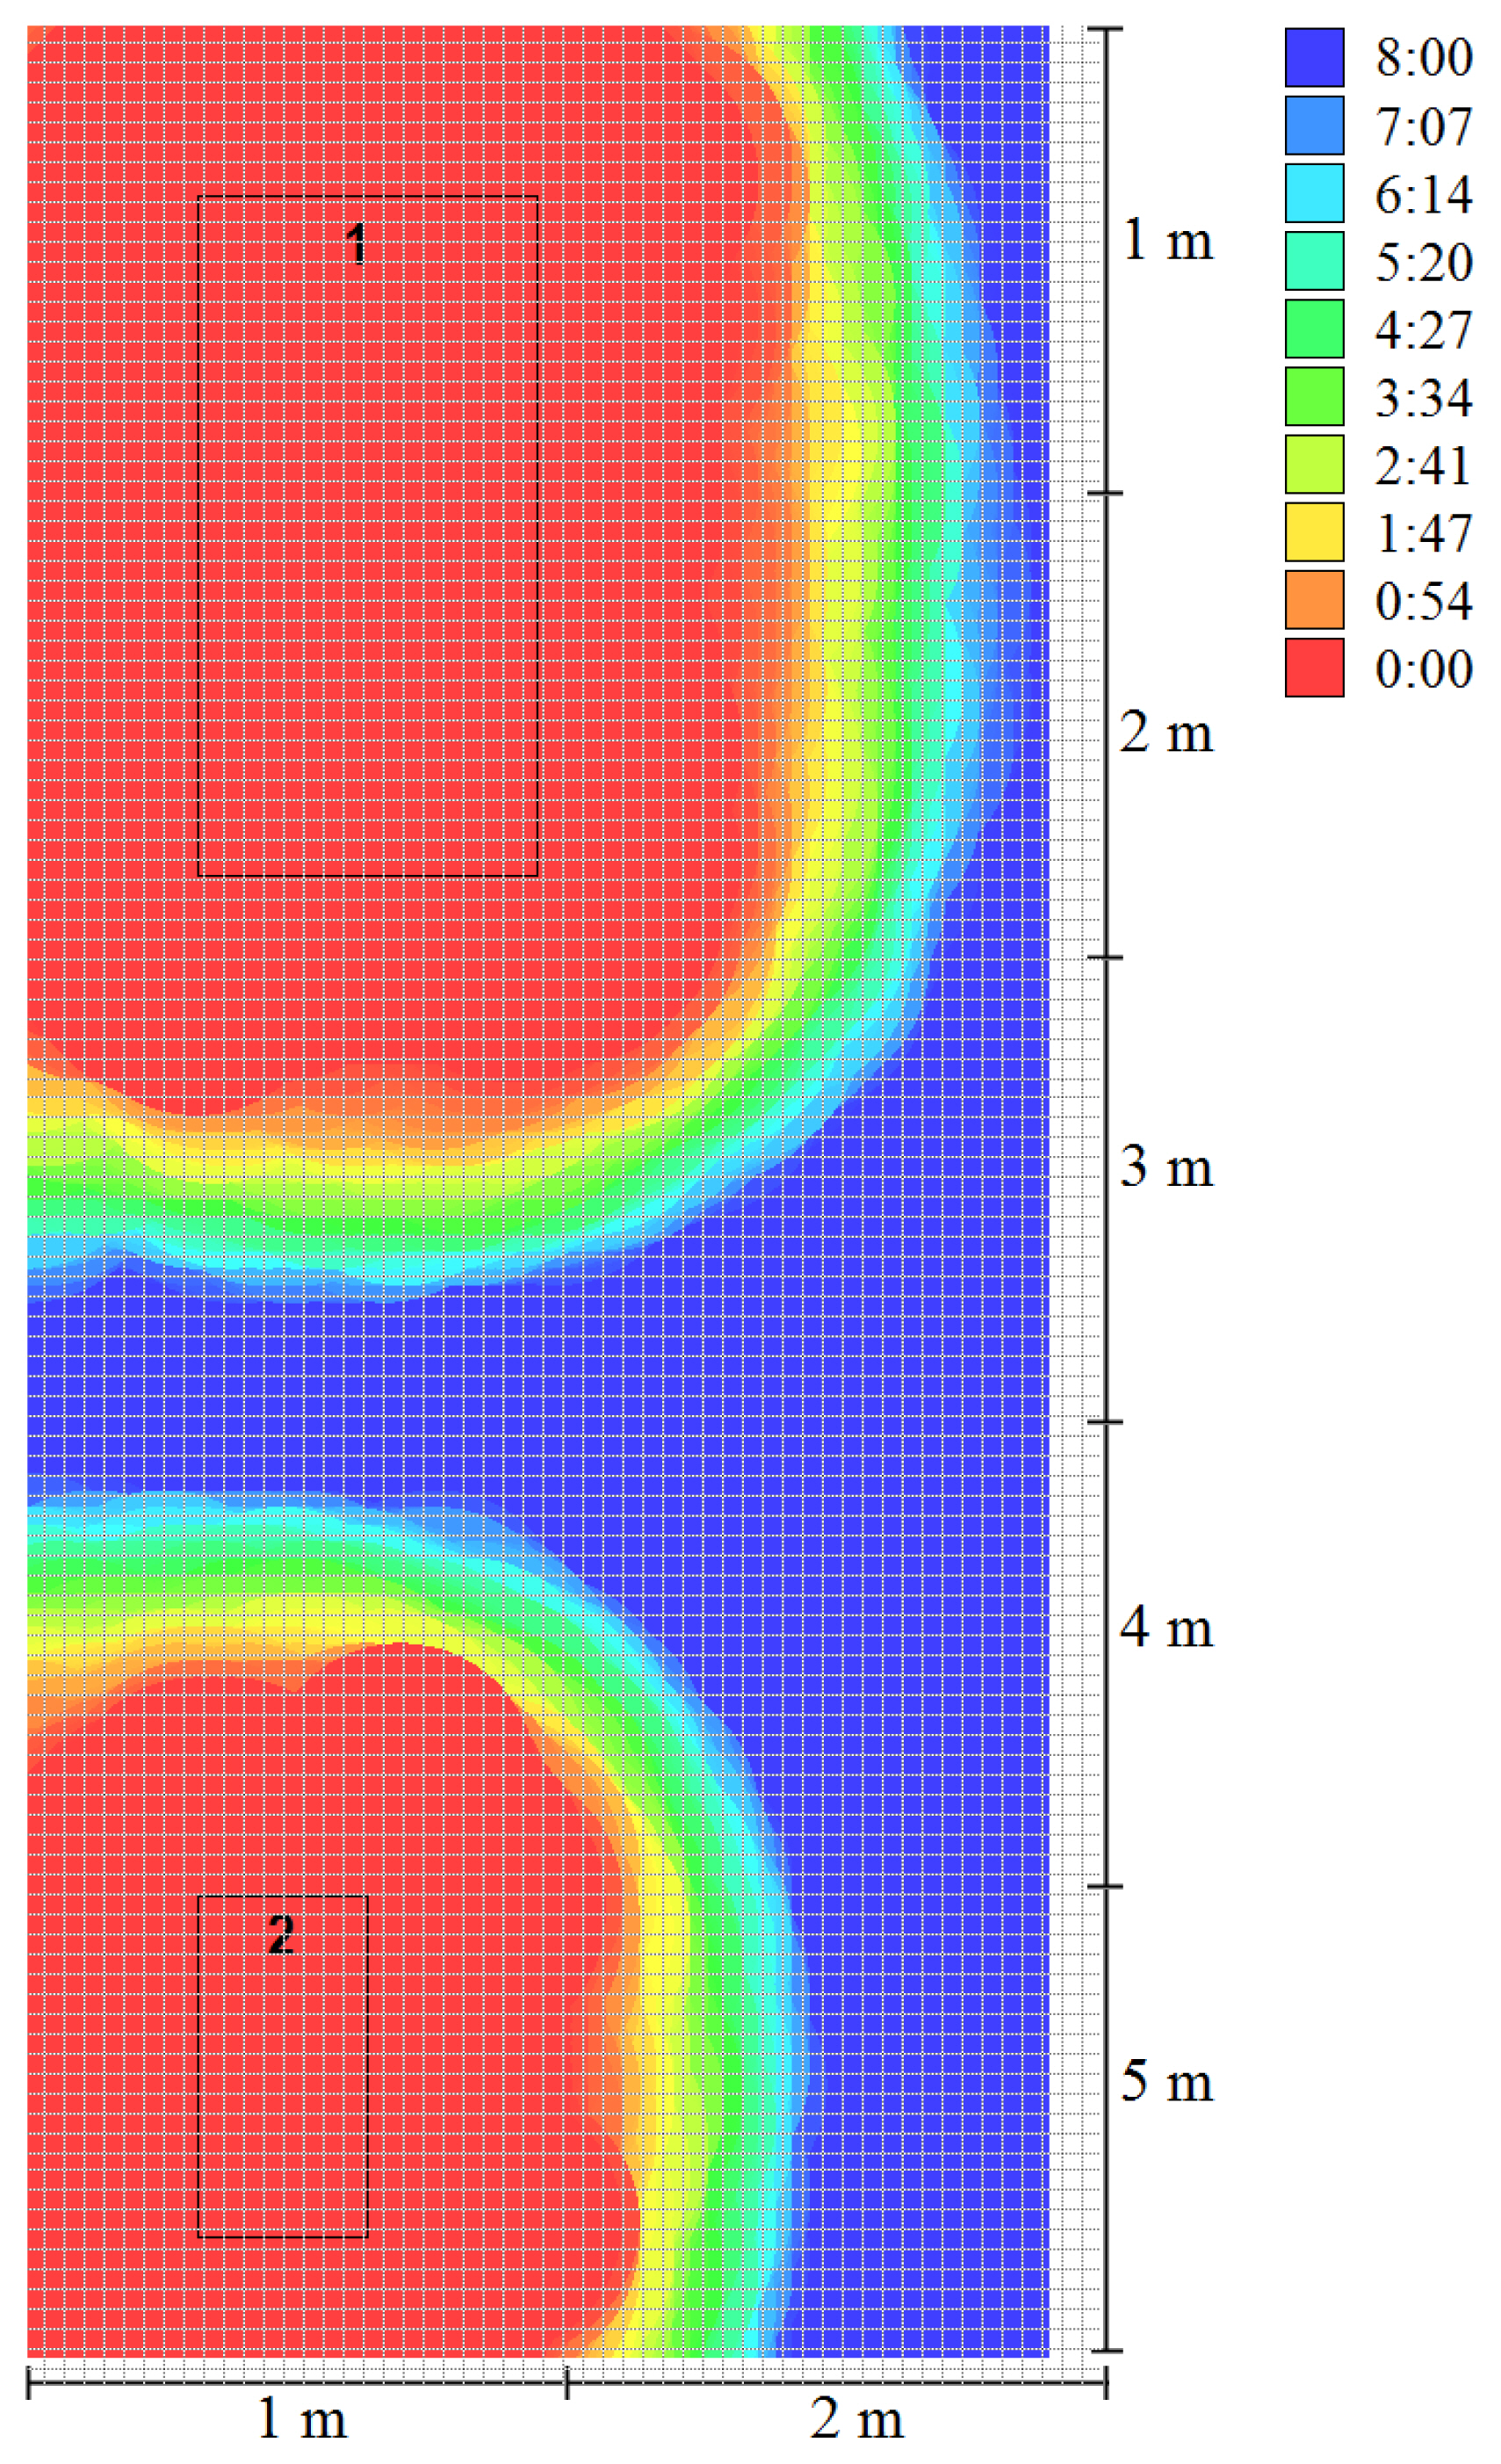
Combined cylindrical EM radiation hazard map (hours of allowed time to stay). “1” indicates climate control system and “2” electric panel.
where Esum j denotes the total electric field intensity (j-th normalized range, V/m); EMPL j represents the permissible level for the electric field intensity (j-th normalized range, V/m); Hsum l signifies the total magnetic field intensity (l-th normalized range, A/m); HMPL l means the permissible level for the magnetic field intensity (l-th normalized range, A/m); Ssum k refers to the total energy flow density (mW/cm2); SMPL k denotes the permissible level for the energy flow density (l-th normalized range, mW/cm2); m represents the number of ranges for which E is normalized; p signifies the number of ranges for which H is normalized; and s refers to the number of ranges for which S is normalized.
Thus, the proposed approach allows determining the permissible residence time in the zones of superposition of EM fields when irradiated from several radiation sources with different values of the remote control and EM interference with different levels of intensity. This includes taking into account the amplification of the combined effect of the EM field components under their complex influence.
IV. Conclusion
The described intellectualized system allows controlling and visualizing the EM environment under the simultaneous influence of several radiation sources, including the combined influence of different EM field components. For the spatial zones with no overlay between the hazard zones of different components, the generated EM radiation hazard maps are used to prepare the protective measures based on the values of the EM field components in the measurable frequency ranges. For the zones, where multiple frequency components intersect, a complex algorithm to calculate the hazard should be used. A perspective model for this is the EM radiation hazard map overlay model that accounts for the increase of the resulting EM field hazard measure under the conditions of complex EM radiation influence (in the frequency range of up to 3 THz).
The resulting hazard maps with the allowed time to stay in the various facilities or building zones are used to derive the protection measures for personnel, with respect to every frequency that influences the studied space. The social effect of using the developed system could be achieved through the accelerated and more adequate gathering of information about the level of EM pollution. This allows choosing the effective measures to ensure the EM compatibility of both techniques and biological objects. At the same time, labor costs are reduced by almost 40 times when determining the state of the EM environment, which confirms the economic feasibility of the proposed system.
References
Biography

Evgeny Vladimirovich Titov graduated with honors from Polzunov Altai State Technical University Barnaul, Russia in 2009. He is a doctor of Technical Sciences, a leading researcher, and an associate professor in the Department of Electrification of Production and Life, Polzunov Altai State Technical University. He has more than 200 scientific and educational works, including 8 patents for inventions, a utility model patent, and 39 certificates of state registration of computer programs. Of the 33 scientific awards he has received, the most significant are being the winner of the XI all-Russian competition of youth research projects in the field of energy (“Energy of Youth”) and of the XII competition (“National Environmental Award named after V. I. Vernadsky”) in the category “Ecology of the city.” His research interests include computer simulation of electromagnetic radiation, visualization and study of the spatial distribution of electromagnetic signal levels, mapping of the electromagnetic environment, and electromagnetic safety.

Alexander Andreevich Soshnikov graduated from the Altai Polytechnic Institute, Barnaul, Russia in 1973. He is a doctor of Technical Sciences, a professor in the Department of Electrification of Production and Life, Polzunov Altai State Technical University, and a member of the specialized council for doctoral and candidate theses. Soshnikov has more than 170 scientific and educational works, including a university textbook entitled Fundamentals of Electromagnetic Compatibility. He is a laureate of the Russian government prizes in science and technology and in the field of education.

Ivan Evgenievich Migalev graduated with honors from Polzunov Altai State Technical University, Barnaul, Russia in 2011. He is a candidate of the Technical Sciences program.