


I. Introduction
Synthetic aperture radar (SAR) [1] has been widely developed to obtain high-resolution two-dimensional (2D) images of objects. Usually, optical images are very limited to only day and clear weather conditions. However, SAR images could be obtained in almost any condition, regardless of daylight, cloud coverage, weather, and so on. The SAR system provides a 2D reflectivity map of regions of interest (ROIs) with bright spots from a high backscattered signal. Until recently, it has been impossible for image analysts to process all the collected data from various resources. Due to the rapid growth of such an enormous collection capacity, the demand for automatic target recognition (ATR) has been continuously increasing.
In SAR-ATR [2, 3], it is very important to build a database (DB) of targets of interest (TOIs) from measurement images. However, it is very difficult to construct a measurement DB from various angles. Therefore, it is very hard to recognize the target signature. To overcome this difficulty, the simulation images of TOIs could be generated from inverse SAR (ISAR) [4] to supplement the measurement images.
There is a common procedure for generating simulation images of TOIs. First, the computer-aided design (CAD) model of a target can be generated from a laser scan or indirect information, such as an online CAD model or photos. The accuracy of the CAD model depends on the operating frequency of the SAR system. Second, the radar cross-section (RCS) of the CAD model can be computed using various numerical techniques. In full-wave methods, three main categories, namely, method of moments (MoM) [5], finite element method [6–8], and finite difference time domain (FDTD) [9–12], are very popular in the community of computational electromagnetics. However, these approaches require a lot of numerical complexity of memory and CPU time to solve the problem in the X-band (approximately 10 GHz). To overcome these numerical complexities, fast algorithms, such as the multilevel-fast multipole method (ML-FMM) [13], integral equation-fast Fourier transform (IE-FFT) [14, 15], domain decomposition-finite element method (DD-FEM) [16], and finite difference time domain-message passing interface (FDTD-MPI) [17], have been developed. However, these techniques could still be limited to constructing a simulation DB for target recognition. Therefore, high-frequency techniques [18–20] are very useful and powerful methods, notwithstanding the inaccurate results compared with full-wave methods. Finally, ISAR images can be generated from RCS data using a frequency sweep. Inaccurate modeling and high-frequency techniques should be carefully handled.
Deep learning frameworks, such as TensorFlow [21], PyTorch [22], and others [23–25], have been widely used with GPU-accelerated libraries. Frameworks based on convolutional neural networks (CNN) [26] have been developed and specialized in image recognition and computer vision. The Visual Geometry Group (VGG) network [27] by the University of Oxford has been very popular in its good performance despite its simplicity. The Pix2pix [28] network learns mapping from input images to output images. The network creates a desired image by the conditions of the latent variables. The generative adversarial network (GAN) [29] efficiently learns to generate new images with the same statistics as a training set. The main disadvantage of this technique is that the network should have paired images for the training sets. CycleGAN [30] proposes an image translation technique from a source domain to a target domain without paired sets. In the area of SAR-ATR, deep learning research is continuously increasing. Deep learning research based on CNN [31], faster region-CNN (R-CNN) [32], you only look once version 2 (YOLOv2) [33], etc., has been analyzed, tested, and developed.
This paper proposes a measurement image translation-automatic target recognition (MIT-ATR) method based on CycleGAN with an SAR simulation DB. The uniqueness of the proposed method is that it translates from measurement images to simulation-like images. The main reason for using a simulation DB is that the measurement images are not sufficient at all angles. Therefore, CycleGAN is considered and recommended to supplement measurement images owing to unpaired image-to-image translation. The main difficulty in using a simulation DB is generating images similar to measurements. Conventionally, simulation images are pre-processed by image adjustments, such as an image filter, intensity, histogram statistics, etc. These techniques are very inconvenient and time-consuming processes. The proposed approach is to generate simulation-like images using CycleGAN. The generated images are tested by a VGG neural network. The performance of the proposed approach is much better than that of the VGG.
The outline of the article is organized as follows: Section II provides a description of the MIT-ATR technique, Section III demonstrates the accuracy and performance of the proposed approach, and finally, the paper is concluded in Section IV.
II. A Measurement Image Translation-Automatic Target Recognition Technique
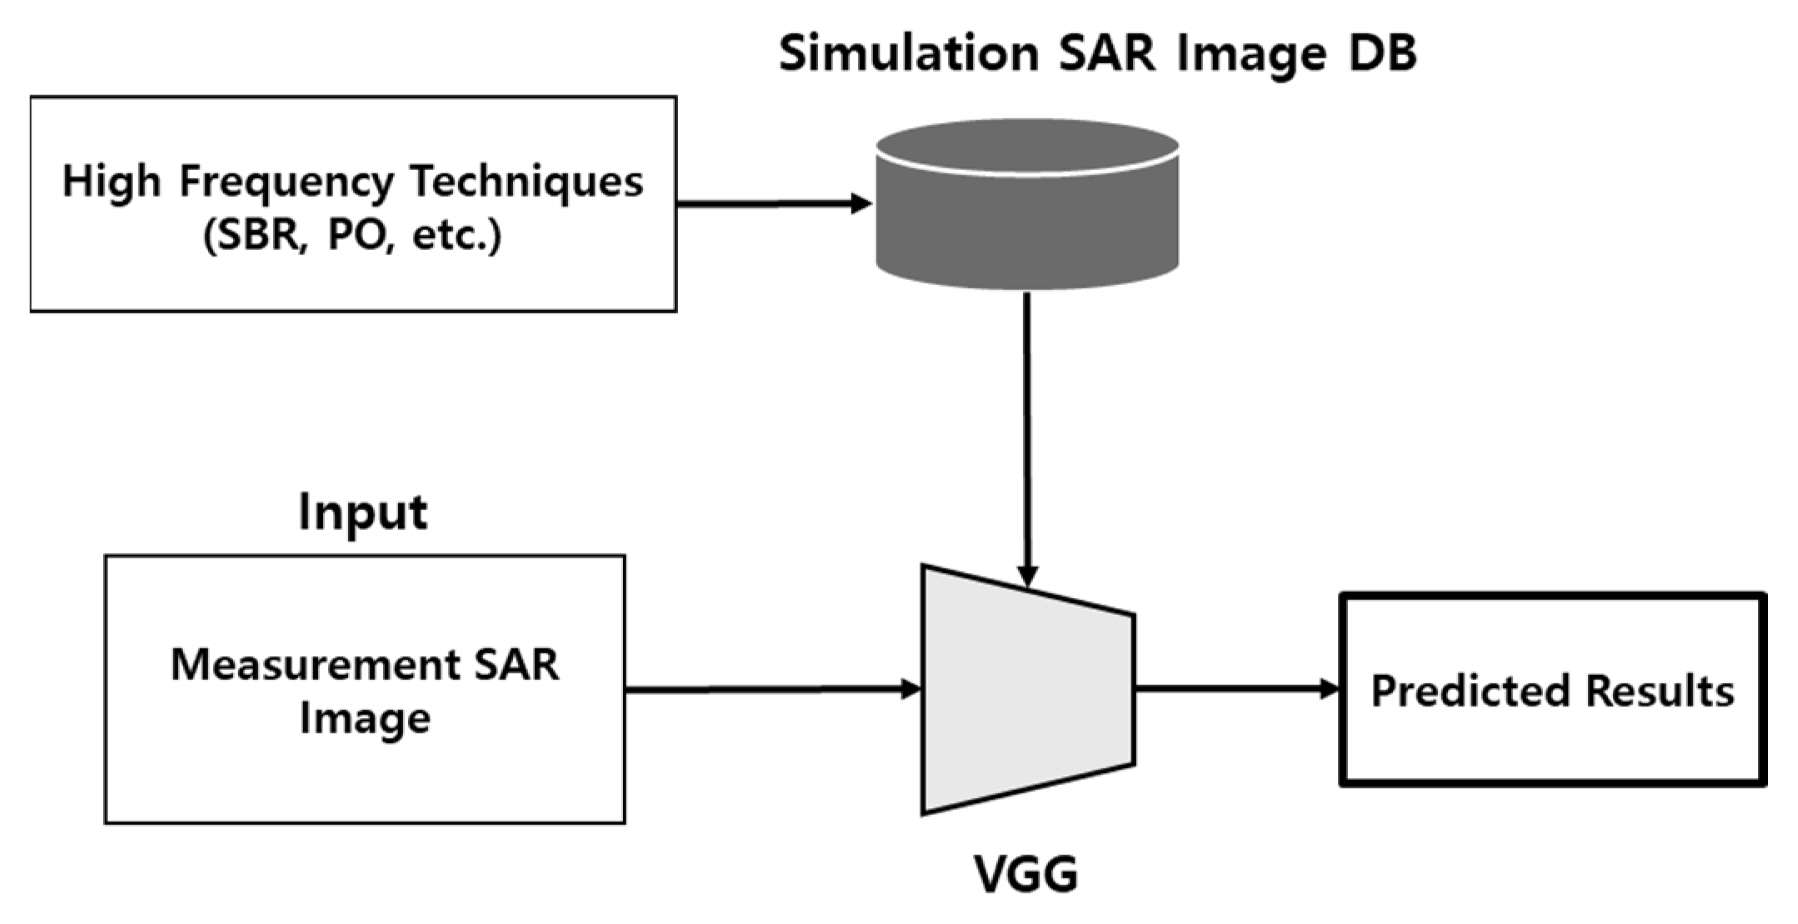
An MIT-ATR technique is proposed to enhance target classification when the simulation DB is available. The proposed approach has two steps. The first step is the translation process through CycleGAN. A measurement image with noise is translated into an image similar to a simulation image generated from a high-frequency technique, such as shooting and bouncing rays (SBR), physical optics (PO), etc. The second step is the classification process through the VGG network. These steps are much better than the VGG network on its own. Fig. 1 shows the conventional target recognition approach. Due to insufficient measurement DB, the simulation DB is used. However, the accuracy of target recognition is extremely limited due to discrepancies between the measurement and simulation images.
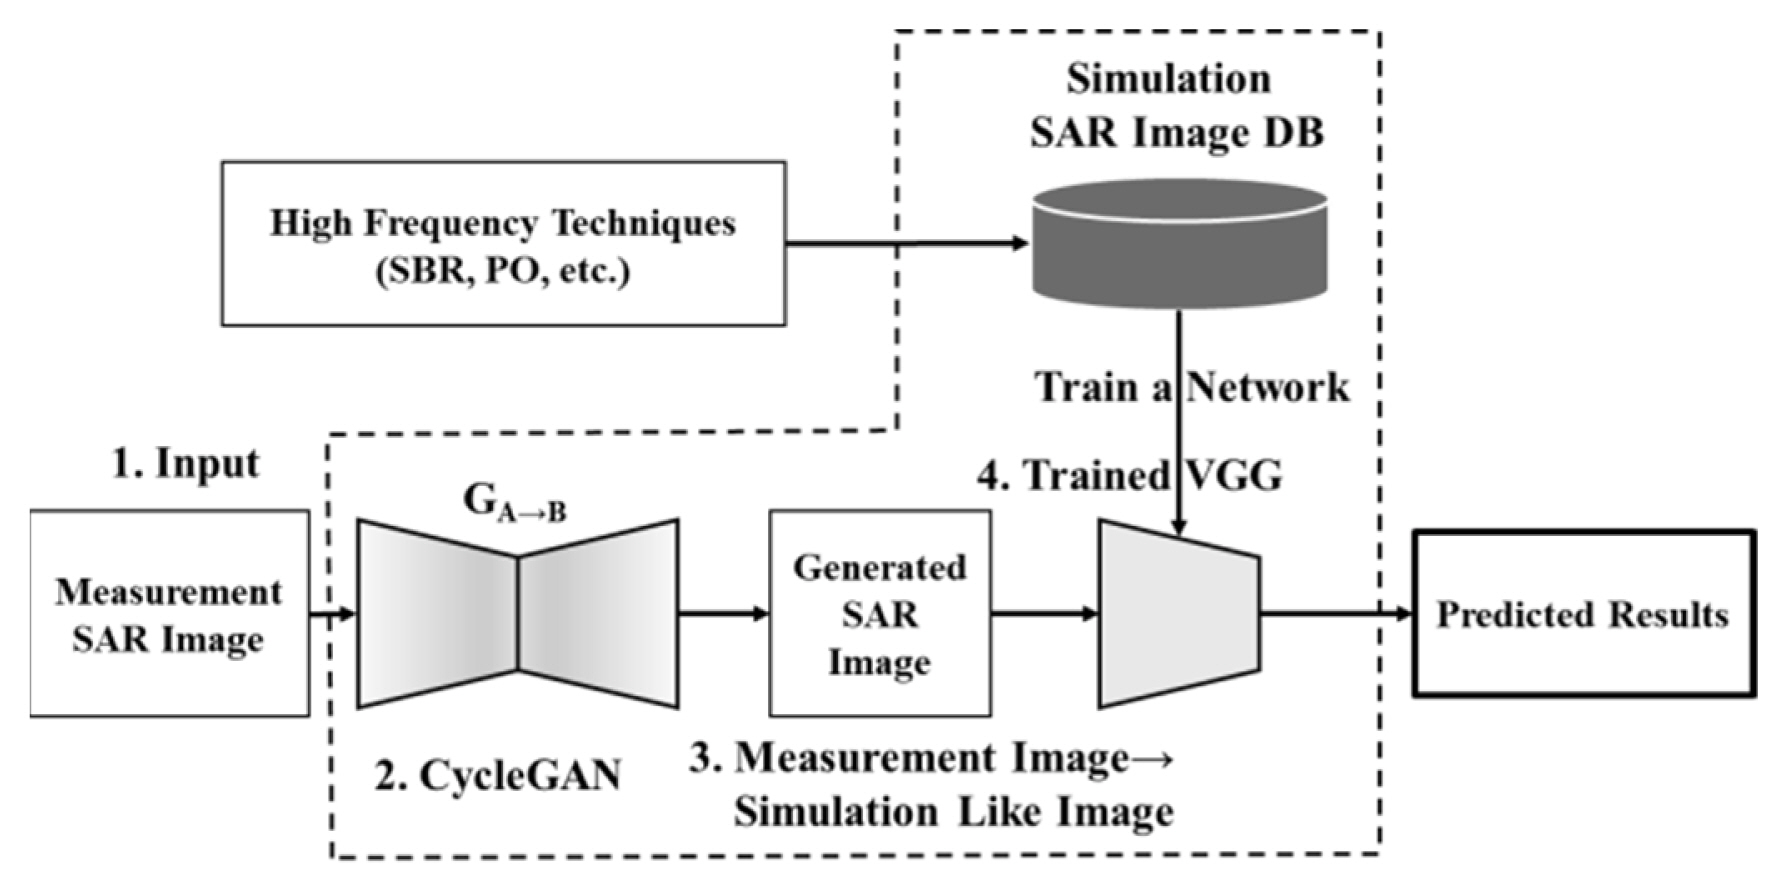
Therefore, an MIT-ATR approach based on the VGG network with the simulation DB is shown in Fig. 2. In the training stage, the measurement images are trained on CycleGAN to construct simulation-like images. On the other hand, the simulation images are trained on the VGG network with the simulation DB due to the lack of measurement data. In the testing stage, the measurement images are translated into simulation-like images. The VGG network trained with the simulation DB classifies the translated images as a softmax function of multiple classes. The main difference between the conventional and proposed approaches is the translation stage from measurement images to simulation-like images.
1. VGG Network based on CNN
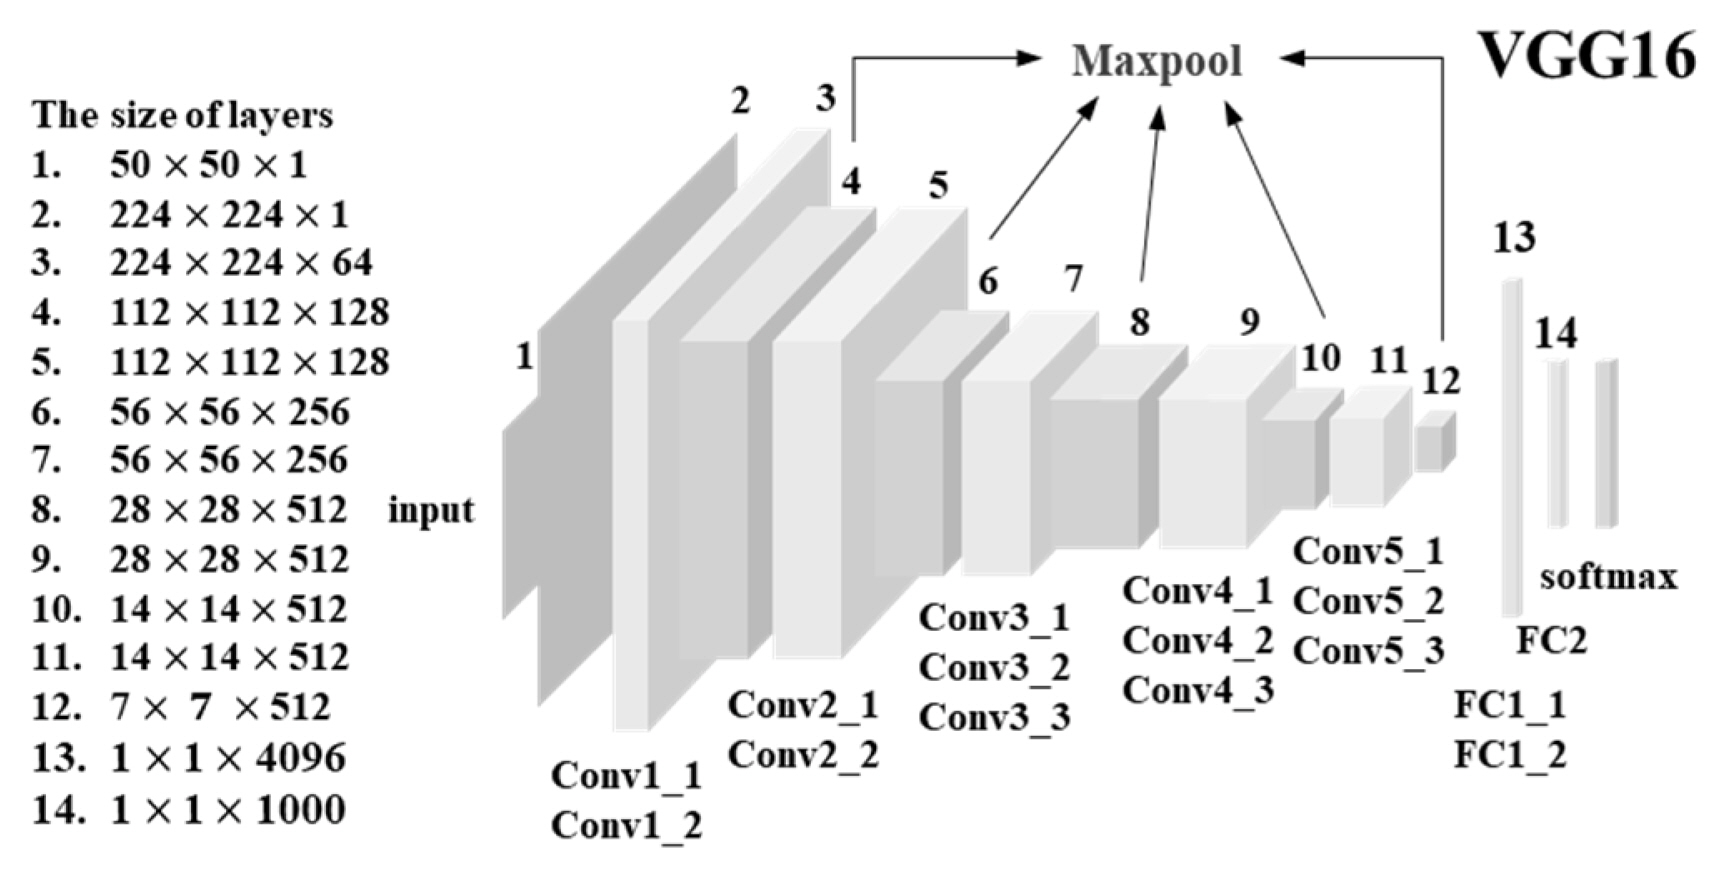
In this section, a VGG network based on transfer learning is used for target classification by ImageNet [34]. The VGG16 network is shown in Fig. 3. Originally, the input of VGG16 was a fixed-size 224 × 224 RGB image. In this paper, the size of the input images is a 50 × 50 gray image, which is the maximum size of TOIs. For transfer learning, 50 × 50 SAR images should be resized to fit the input size of VGG16 by bi-cubic interpolation. The resized SAR images train the basic VGG16, which consists of convolutional, max-pooling, fully-connected (FC), and soft-max layers. The convolution filters have 3 × 3 pixel windows. Five max-pooling layers are followed by some of the convolutional layers. Finally, a stack of convolutional and max-pooling layers is followed by three FC layers. The outputs of the softmax layer are the five classes in this paper.
2. Cycle Generative Adversarial Network
The use of a simulation DB could solve the lack of measurement data. However, using only the VGG network does not guarantee the accuracy of the target classification. In this section, CycleGAN is proposed as the pre-processing of the VGG network. A brief objective of CycleGAN is explained. There are two types of losses in CycleGAN. One is the adversarial loss, which is given by:
and
where G and F are mapping functions from one domain X to the other Y and vice versa, respectively. DX and DY are discriminators between translated samples and real samples. X and Y are two domains for measurement and simulation images. x ~ pdata(x) and y ~ pdata(y) are data distributions of two domains, respectively. The key to GAN’s success is the idea of an adversarial loss that forces the generated images to be indistinguishable from real images. The other is cycle consistency loss, which is expressed as follows:
where ||·||2 indicates L2 norm. Finally, the loss function of CycleGAN is written as follows:
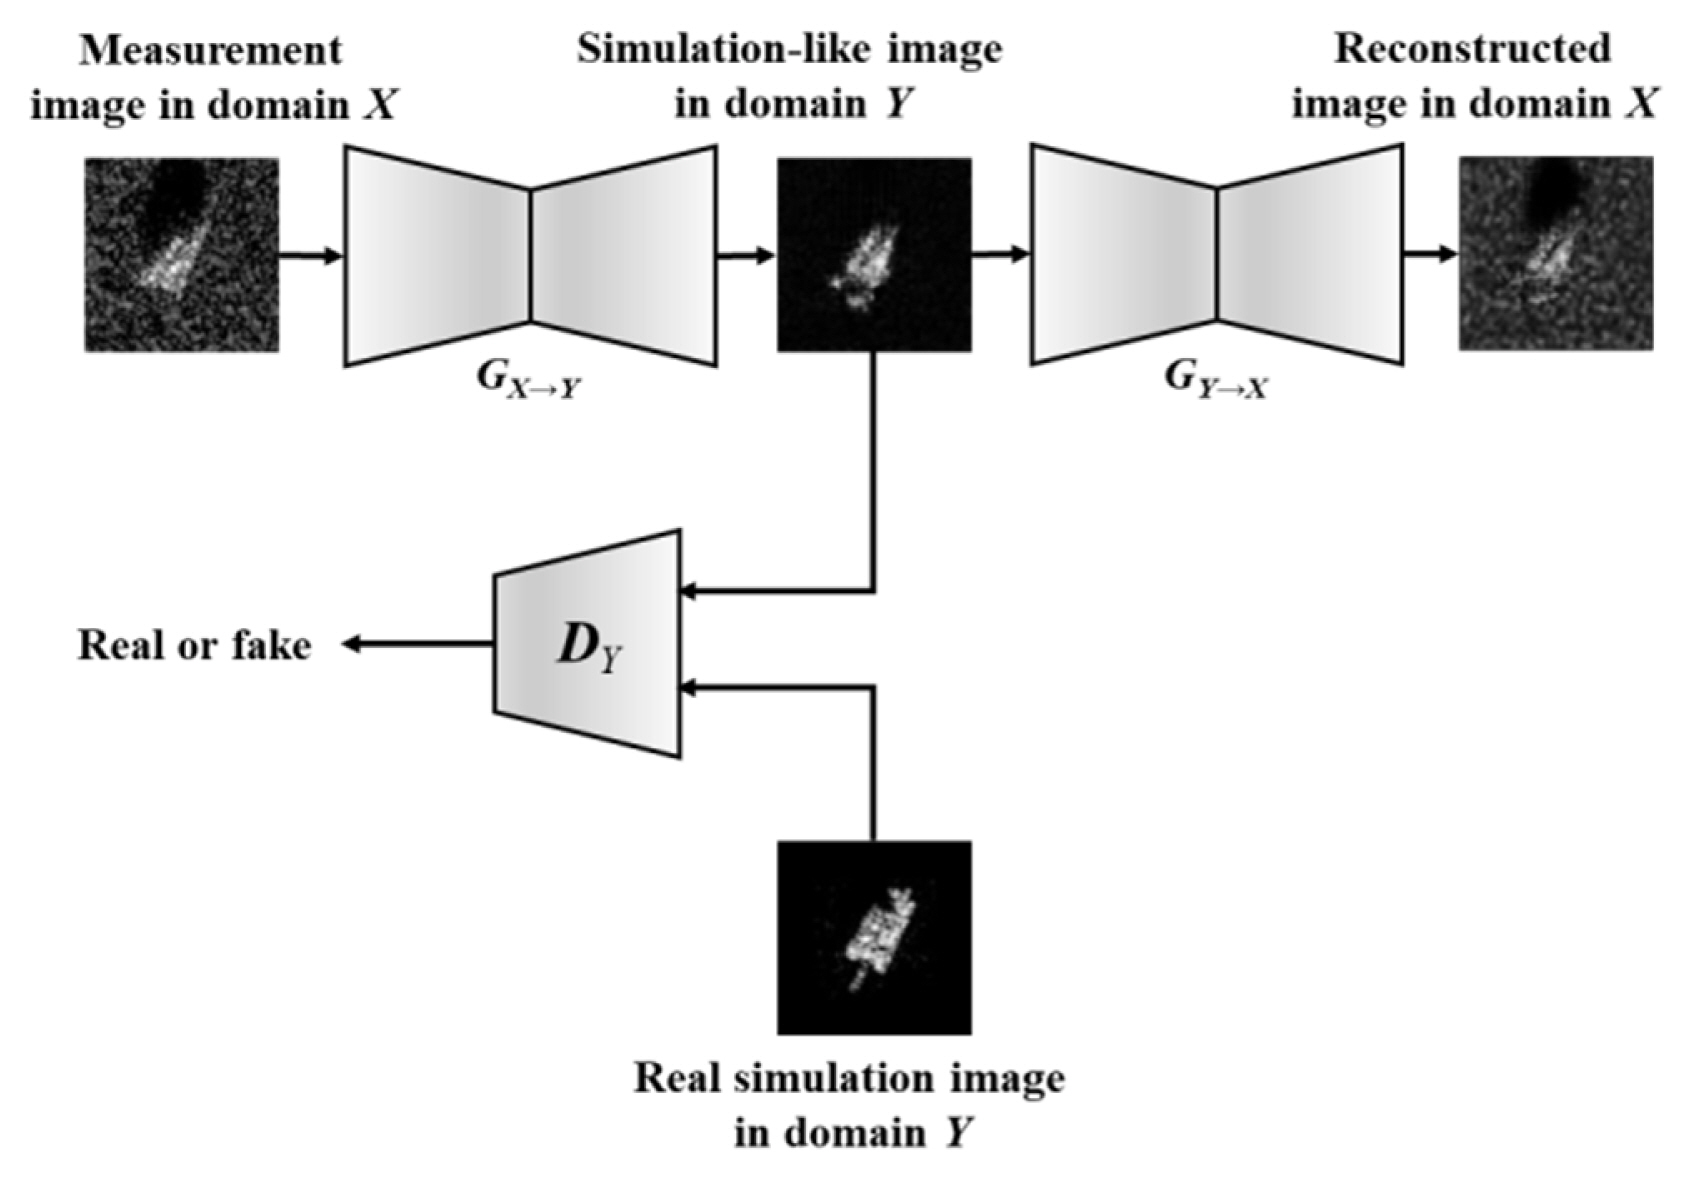
where λ is the weighting constant between two types of losses. In this paper, λ is 10. The details of the implementation of CycleGAN are shown by Zhu [30]. The procedure for CycleGAN is shown in Fig. 4.
The input images could be measurement or simulation images. In this paper, a generator GX→Y translates from a measurement image to a simulation-like image. To ensure cycle consistency, the generated image is translated into a reconstructed image by a generator GY→X. The cycle consistency loss function tries to minimize the difference between a measurement and a reconstructed image. A discriminator DY tries to force the generated images to be indistinguishable from real simulation images. The final goal is to translate measurement images into simulation-like image.
3. A Simulation-Like Image Translation
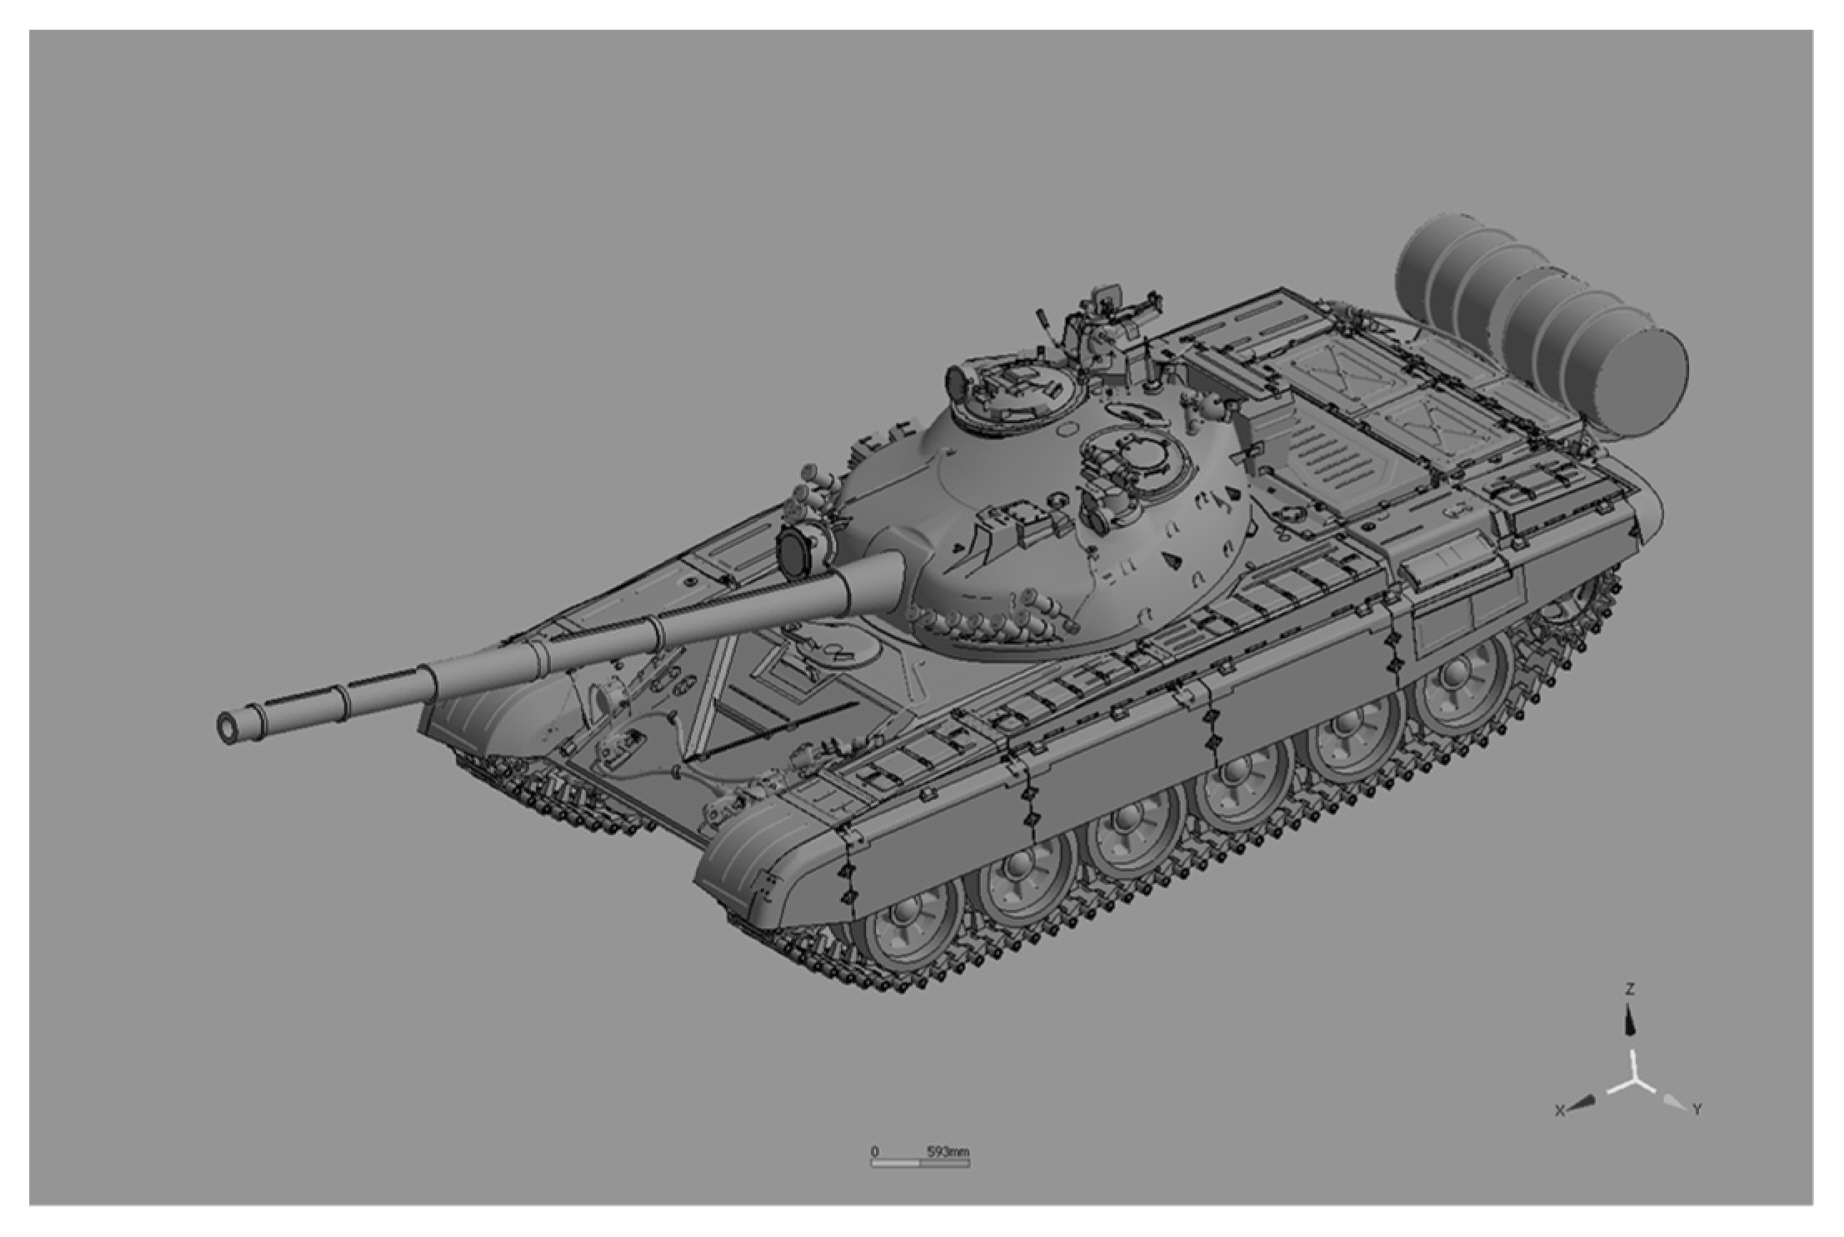
There are two ways to generate unpaired image-to-image translation using CycleGAN. One approach translates from simulation images to measurement images. The other is the other way around. Fig. 5 shows the 3D CAD model of a T-72 tank. In reality, it is not easy to obtain measurement data without a real model. CAD models from indirect information, such as Internet models or photos, could be required to compensate for insufficient measurement data. From the CAD model, a high-frequency technique can create a simulation SAR image using multiple angle and frequency sweeps. However, the measurement images are quite different from the simulation images. Reducing the discrepancy between two images requires a lot of modification based on indirect information. Due to the advent of CycleGAN, such complicated modifications are not necessary to obtain certain accuracy. However, an accurate matching process between measurement and simulation images should be handled carefully if more accurate results are required.
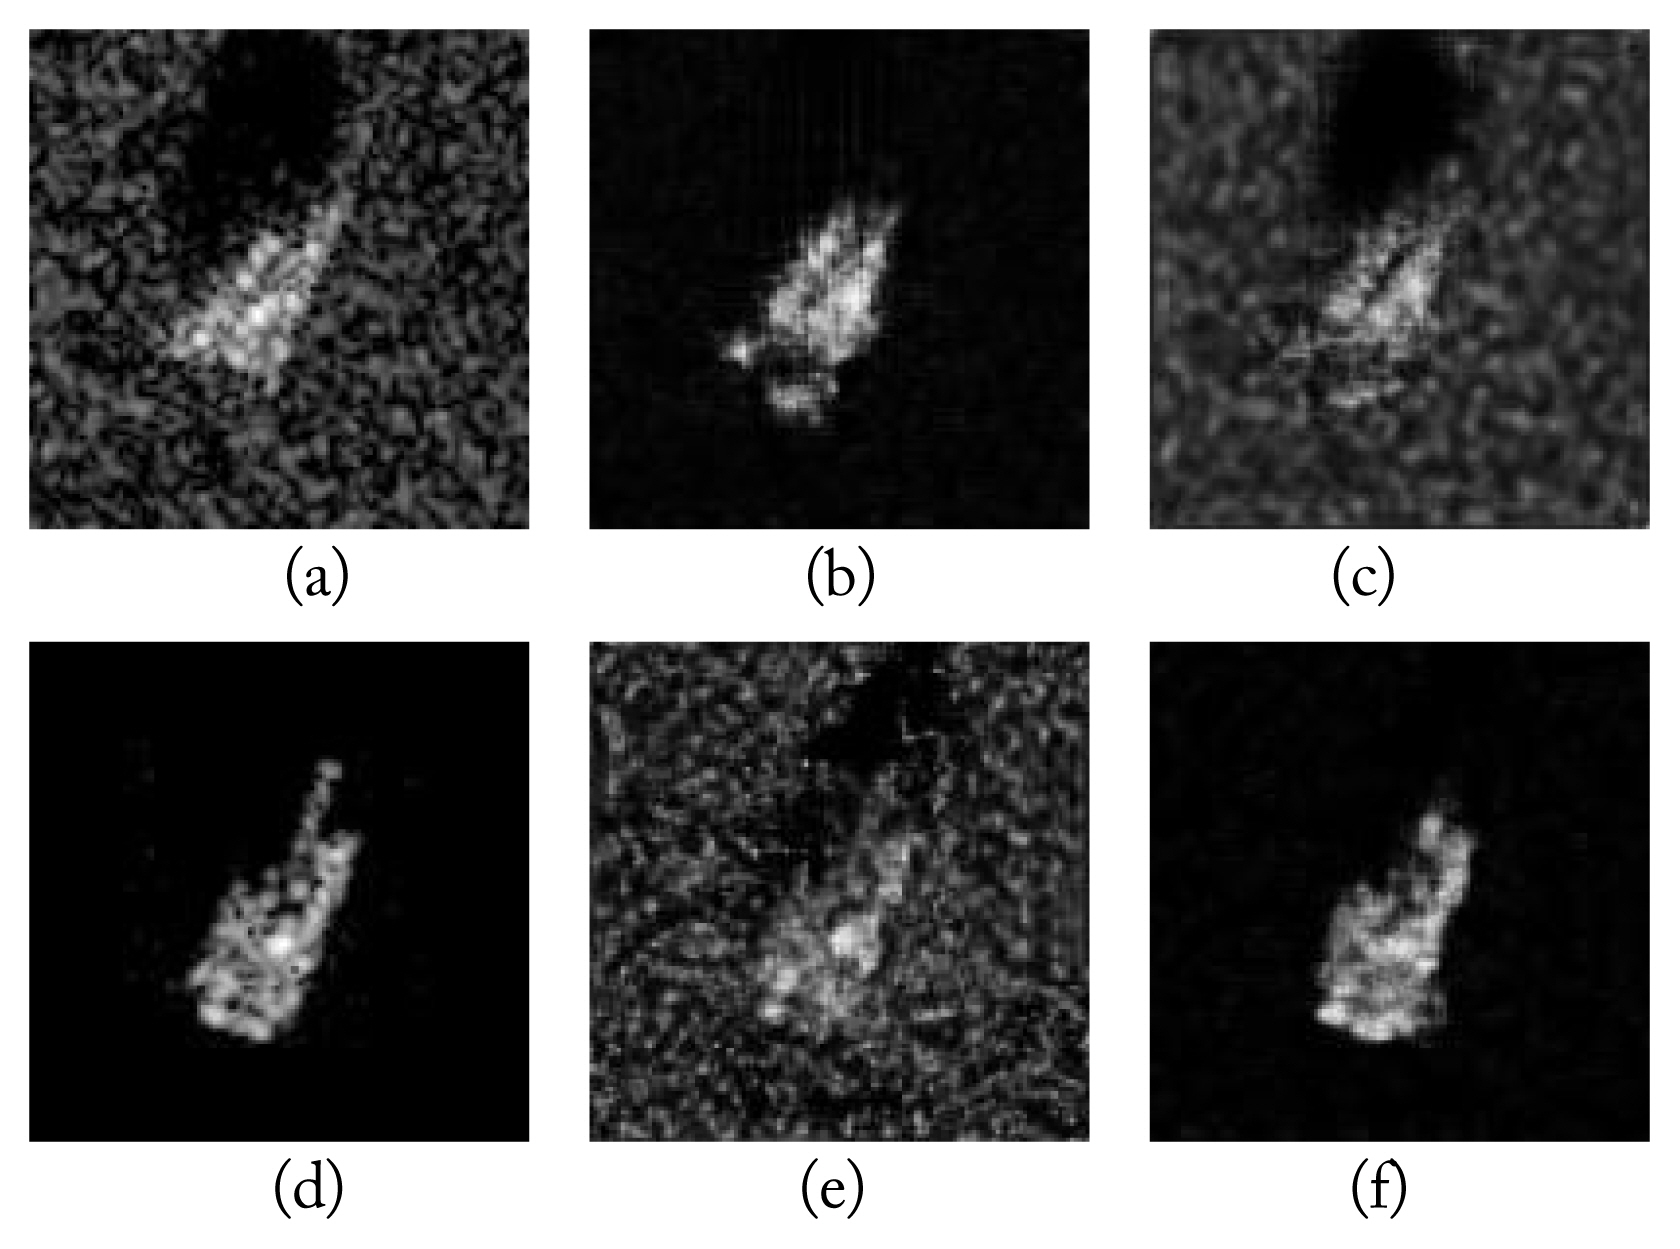
Fig. 6 shows a comparison of the translation results between a measurement image and a simulation image by CycleGAN. The measurement image is obtained at elevation (EL) = 15° and azimuth (AZ) = 20°. The simulation is obtained from a slightly different angle at EL = 14° and AZ = 20°. The measurement data originated from moving and stationary target acquisition and recognition [35]. The original, translated, and reconstructed images from CycleGAN are described in Fig. 6(a)–6(f). The original measurement image X and simulation image Yare shown in Fig. 6(a) and 6(d), respectively. The translated image G(X) from the mapping G:X→Y is shown in Fig. 6(b). The measurement image is translated into a simulation-like image. The reconstructed image F(G(X)) is shown in Fig. 6(c). The consistence loss function between the original and the reconstructed image is minimized by L2 norm. The translated image F(Y) from the mapping F:Y→X is shown in Fig. 6(e). For the consistency loss function, the reconstructed image is generated as G(F(Y)) in Fig. 6(f). In this paper, measurement images are used as an input image X. The translated image G(X) is a simulation-like image. To compute the consistency loss, the reconstructed image is generated as F(G(X)). The loss function is rewritten as follows:
where
The adversarial loss is the same as in Eq. (1). The generator G makes a translated image close to the other domain. The discriminator DY compares the generated image G(X) with the original simulation image Y to minimize the adversarial loss.
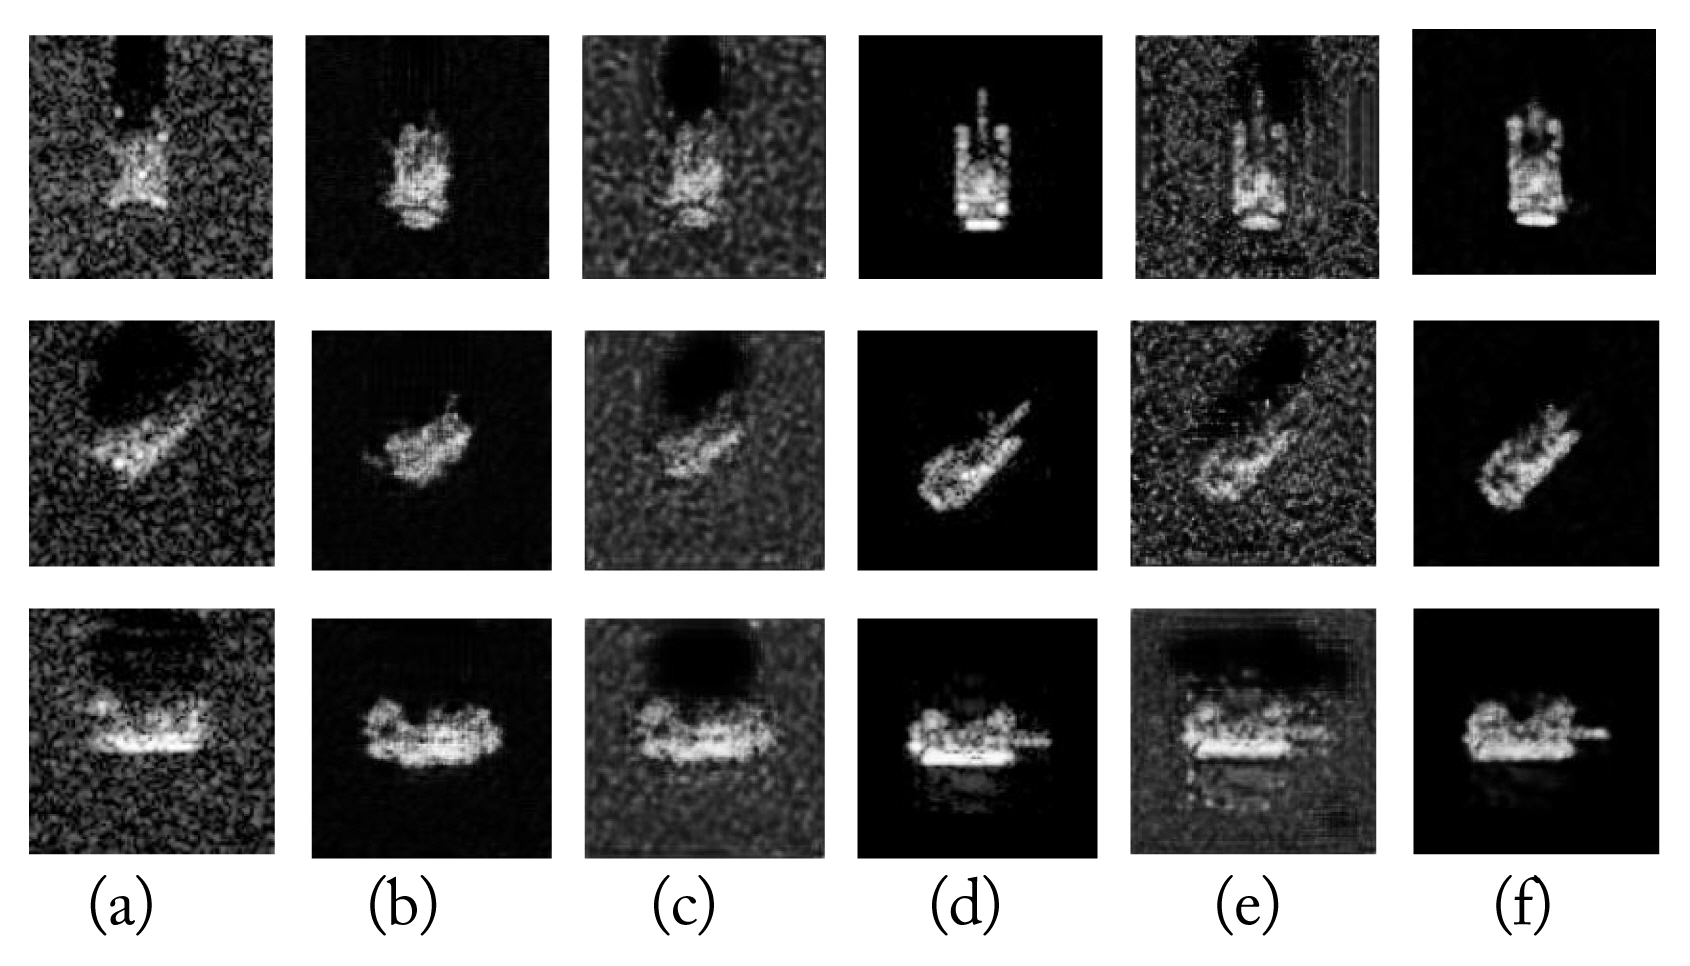
Fig. 7 shows the original, translated, and reconstructed images at various angles. Fig. 7(a) shows the measurement images at EL = 15°, and AZ = 1°, 43°, and 89°. The simulation images are displayed in Fig. 7(d). Each translated image is shown in Fig. 7(b) and 7(e). Each reconstructed image is displayed in Fig. 7(c) and 7(f). In the proposed approach, the simulation-like images in Fig. 7(b) are tested with the simulation images in Fig. 7(d). The generated images are much more similar than the simulation images. Now, the correlation of the original images is compared with that of the translated images. The values of the correlation between Fig. 7(a) and 7(b) relative to Fig. 7(d) are computed. The coefficient of correlation between the measurement and the simulation images is computed by:
where
and
N is the number of pixels for a chip. Mi and Si are the ith pixel intensity of the measurement and simulation images, respectively. μM and μS are the average values of the pixel intensity for the measurement and simulation images, respectively.
The coefficients of correlation between the original and translated measurement images relative to the original simulation images are compared in Table 1. Five pairs of images are shown at different azimuth angles. The average correlation value of the original measurement image relative to the original simulation is 0.5639. However, the average value for the translated measurement images dramatically improved to 0.8076. Overall, the correlation improved to 24%.
III. Numerical Experiments
The proposed approach was compared with the conventional VGG16 network. The proposed algorithm improves the probability of the target classification in five classes when the simulation DB is used. There are two steps: CycleGAN for image translation and the VGG16 network for target classification. The first step generates simulation-like images using CycleGAN. The conventional approach is applied in the second step. Let us experiment with the conventional approach. Table 2 shows the training numbers of the simulation images and the testing numbers of measurement images. The resolution of the images is 30 cm × 30 cm. All SAR images are vertical-vertical (VV) imaginary.
Table 3 shows the confusion matrix of the results of the conventional approach.
Due to the image discrepancy between the testing set and the training set, the accuracy is approximately 15%. The most important fact is that all testing sets are classified as class 2. The backscattered characteristics of class 2 are dominant in all classes. For the improvement of classification, complicated image adjustment and verification processes should be required to reduce the discrepancy between measurement and simulation images. Usually, the measurement data cannot be equally distributed at all angles due to the difficulty of regular acquisition. Therefore, the number of training sets is randomly distributed to each class for an unpaired image-to-image translation. There are two distinct problems. One is to generate simulation-like images. The other is using unbalanced datasets between measurement and simulation images. The key ingredient processor is the unpaired measurement to simulate image translation in the paper. In reality, there is only a small set of measurement data used as a training set. Therefore, the simulation data are randomly extracted in the same number as the measurement data.
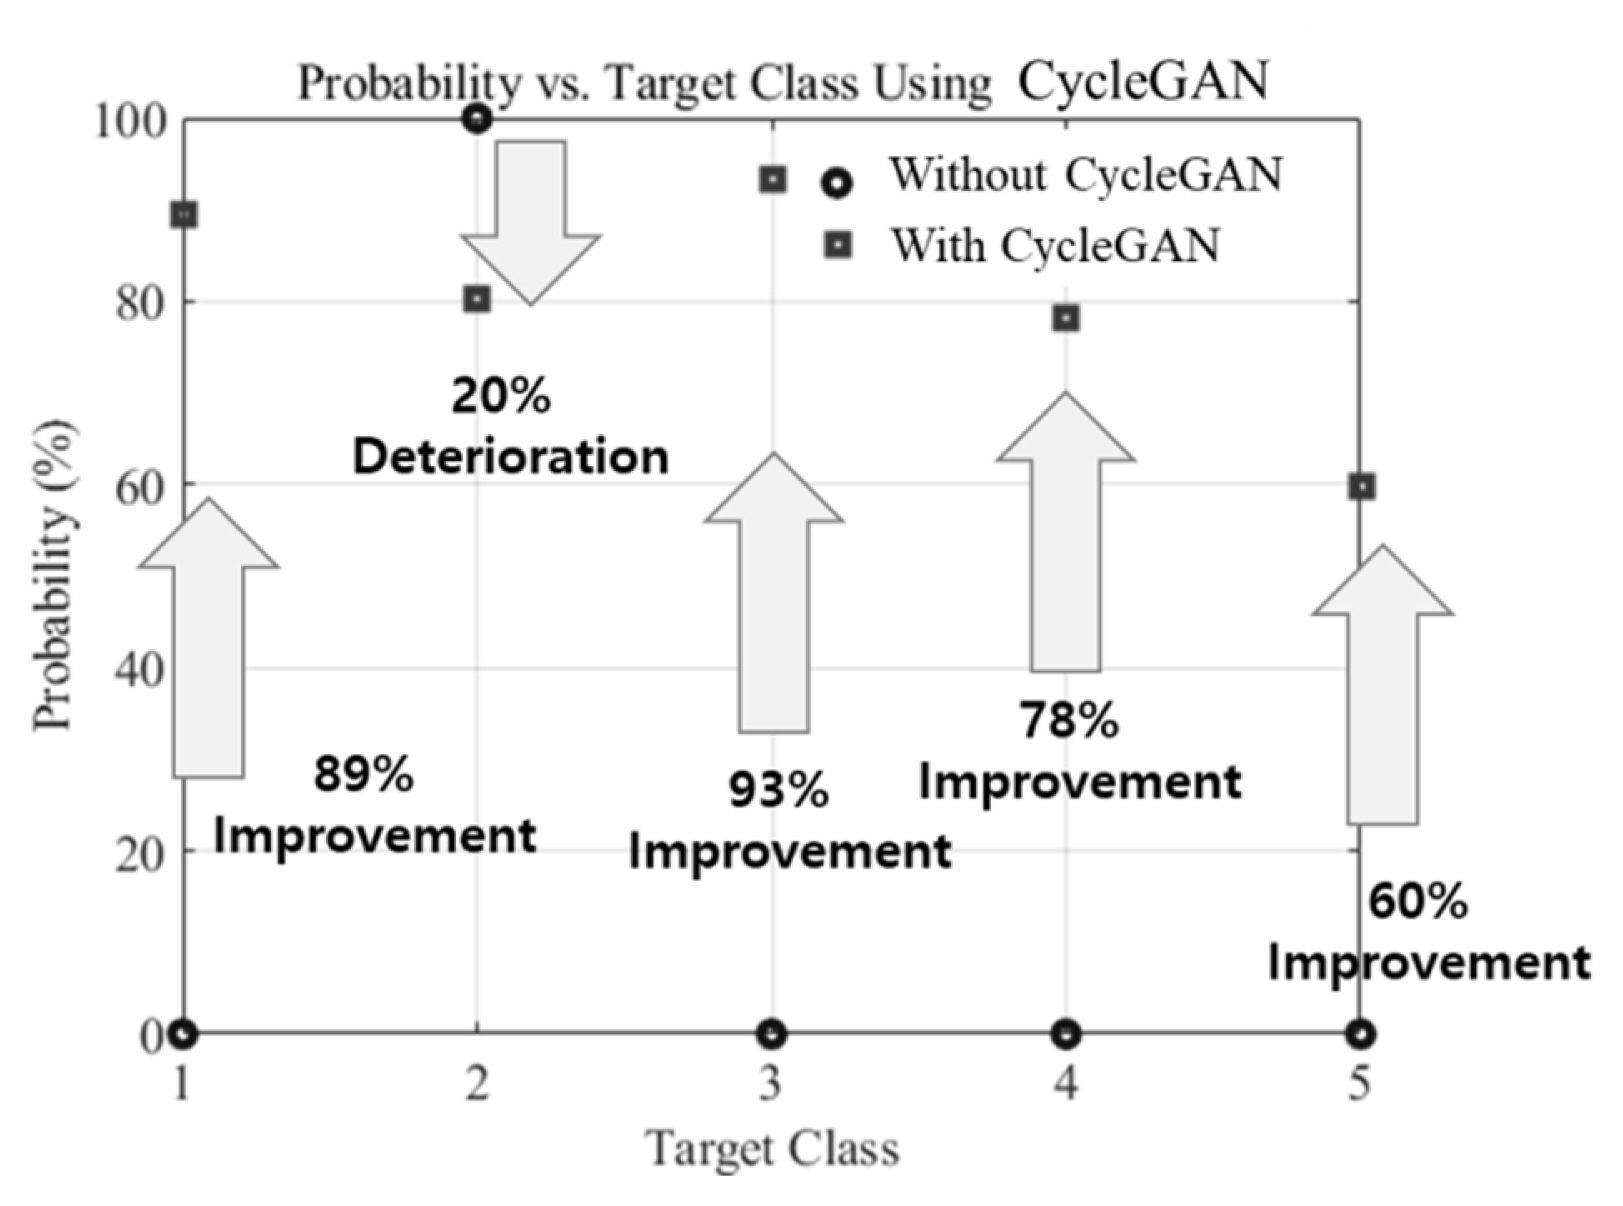
The summary of image sets for domain X and Y is shown in Table 4. Based on the proposed algorithm, the results of the target classification are given in Table 5. From the confusion matrix, the accuracy is approximately 80%. Fig. 8 shows the improvement and deterioration of each target class. Overall accuracy improved. The improvement of Class 5 is lower than those of the other classes. The reason is that the data of class 5 and the other classes are obtained from the heterogeneous SAR sensors.
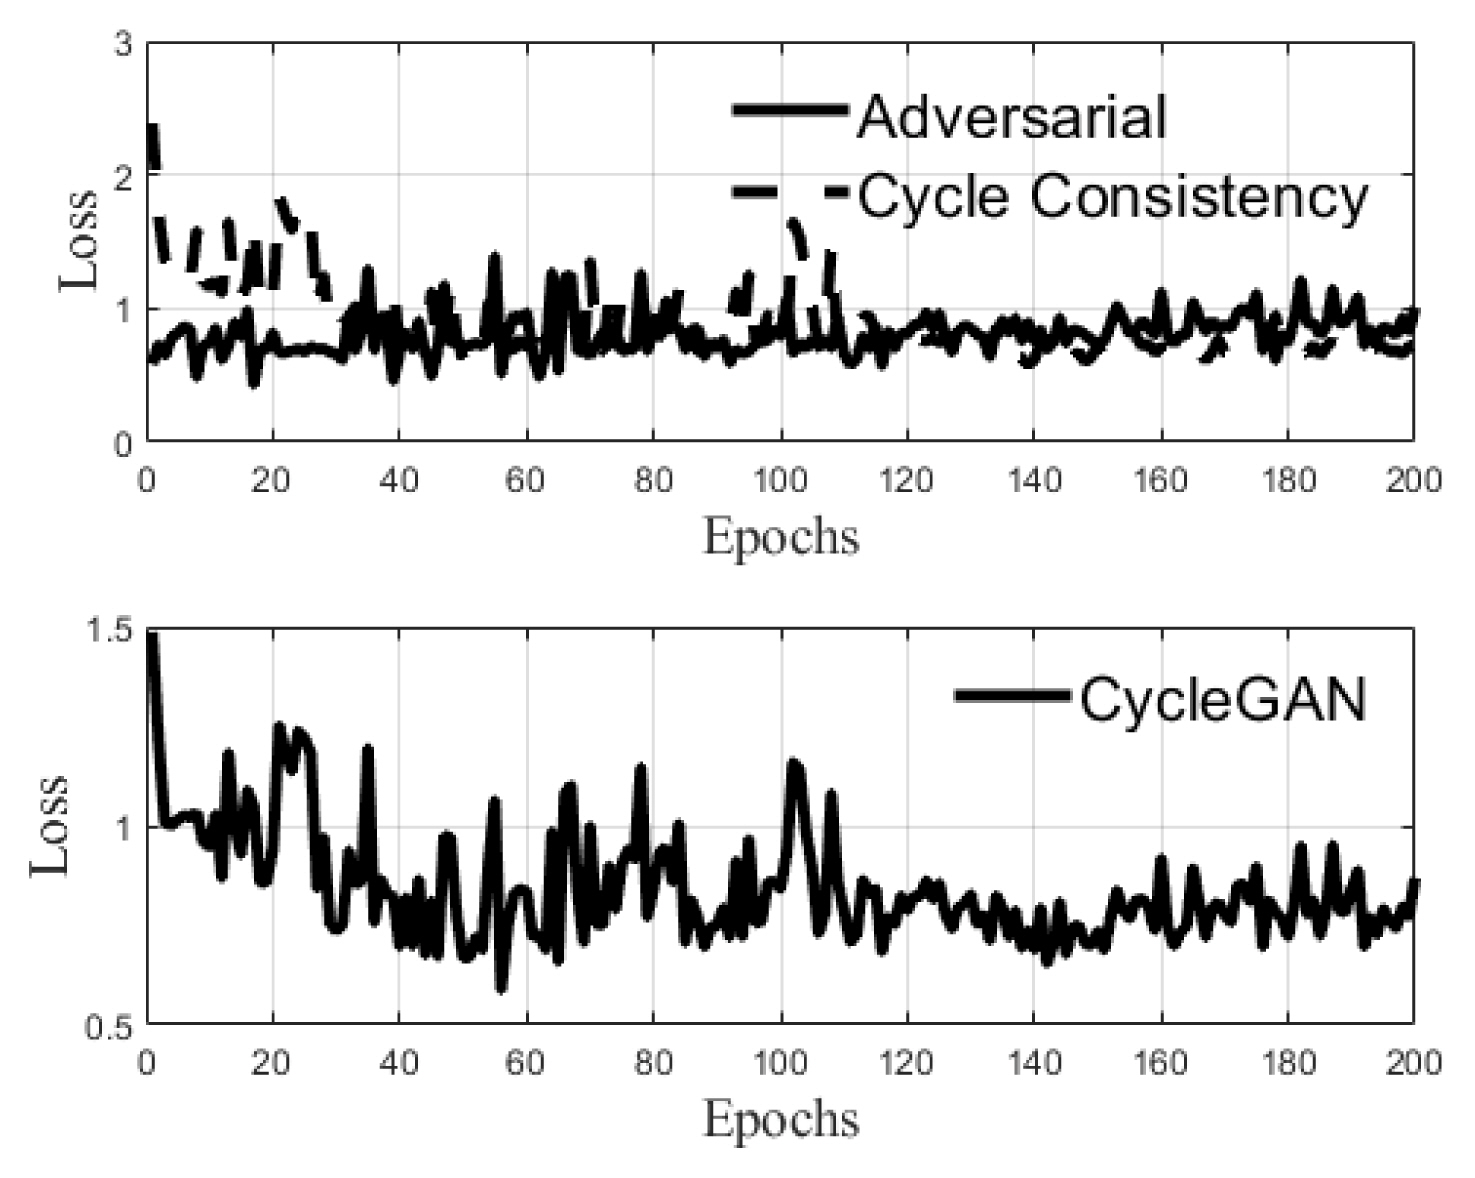
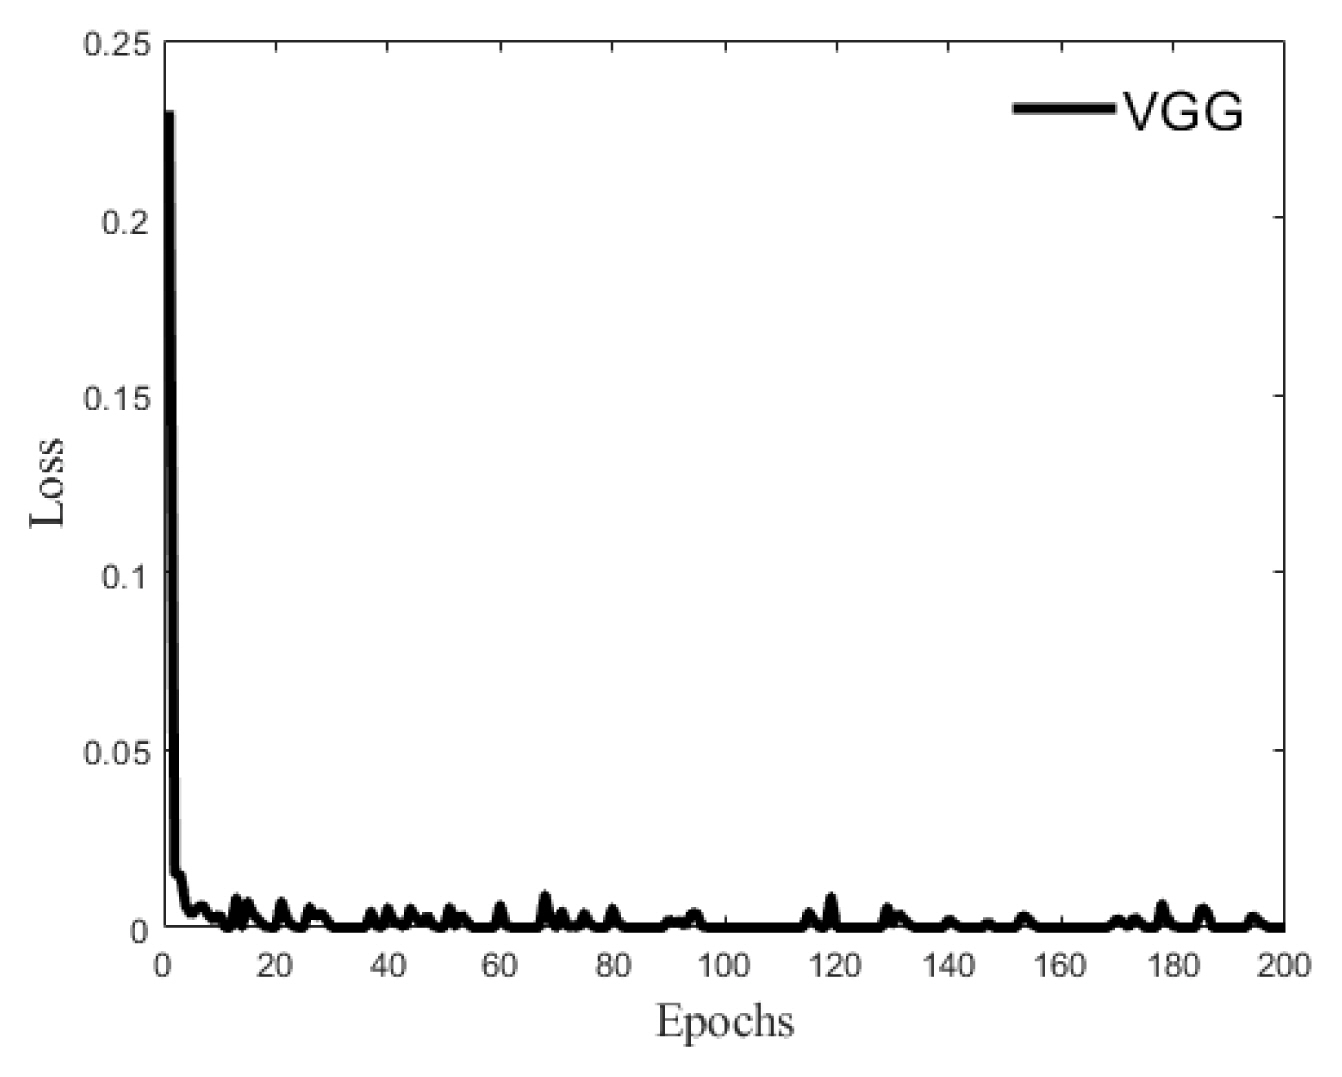
Fig. 9 shows the losses of adversarial and cycle consistency versus epochs. Here, epochs is 200, β1=0.9, β2=0.999, the learning rate μ=10−5, and batch size is 16. In the top figure, the solid line indicates adversarial loss, and the dashed is cycle consistency loss. The bottom figure shows the CycleGAN loss. After 110 epochs, the error converged less than 1.0.
IV. Conclusion
The proposed approach has the unique feature of SAR-ATR by two distinct deep learning networks when the simulation DB is used. The key ingredient of the algorithm is to translate from measurement images to simulation-like images using CycleGAN. From the confusion matrix of five classes, the accuracy is approximately 80%. The accuracy improved by more than 60%. The correlation is close to almost 80%. The measurement images are translated to the images very similarly to the simulation by CycleGAN. The proposed approach demonstrates that the simulation DB can easily be used without any complicated pre-processing techniques.