


I. INTRODUCTION
While the number of people aged 65 years or older is expected to continue increasing [1], caregivers for the elderly have become scarce due to the rising elderly population, resulting in an increasing number of the elderly people living alone or in families comprising two elderly spouses [1]. Several factors, including coronavirus disease 2019 (COVID-19), have compelled the elderly to spend a considerable amount of their time indoors. Under such circumstances, an unforeseen crisis would be difficult for them to manage if no help is present nearby. Falls account for the largest proportion of injuries among people older than 65 [2], since loss of muscle mass due to aging often causes elderly individuals to lose their balance and fall. In the absence of prompt treatment, a fall-related injury may even become severe. As a result, precise and prompt detection is of utmost importance in such cases. Moreover, long-term research has accurately identified falls as a hazard to the health of the elderly [3–6].
However, since certain circumstances cannot always be controlled, several researchers have attempted to detect falls using different kinds of sensors. Current research on fall detection can be divided into studies on contact sensors and non-contact sensors based on the detection equipment employed. In the context of contact sensors, accelerometers [3], gyroscopes [4], and smartphones [5], which are typically worn around the waist and on the wrists during experiments, are frequently employed [6]. However, contact sensors are characterized by numerous drawbacks, such as the need for charging connectors, inadequate mounting positions, and the discomfort of constantly wearing them. Alternatively, non-contact sensors mostly use cameras and radars [7–9]. For instance, camera-based fall detection recognizes human silhouettes in recorded videos and classifies movements by extracting binary image motion characteristics [7]. In such cases, either the binary picture is separated into five zones depending on the person’s silhouette to determine the person’s condition [8] or a multilayer perceptron algorithm is used to classify different aspects, such as the person’s form, head position, and motion [9]. However, although cameras can identify the specific behavior of a target, they are light-sensitive and cannot be mounted in private areas, such as toilets and bedrooms.
Radar is commonly employed for fall detection owing to its ability to address the drawbacks of both contact sensors and cameras, as well as due to its suitability for indoor detection [10–15]. Previous studies have employed impulse radio ultra-wideband radar for fall detection utilized convolutional neural network algorithms, while accounting for the following inputs: time of arrival of signals [10], range map [11], fast Fourier transform (FFT) image [12], and singular value decomposition image [12]. Notably, researchers have mostly relied on velocity information to identify falling objects when using frequency-modulated continuous wave (FMCW) radar [13–15]. Furthermore, most previous studies employed categorization algorithms based on deep learning that accepted Doppler map pictures as input to subsequently reflect changes in object velocity over time [13]. Recent research has focused on enhancing the effectiveness of fall detection by utilizing an approach that converges or classifies several features. Studies have experimented with using a combination of deep learning techniques, such as AlexNet, VGG-19-Net, and VGG-16-Net, to extract velocity features [14] or have employed the method of classifying four different actions into two groups, with range maps as inputs, to then classify each group using Doppler maps [15].
A fall involves a large, fast-moving body that moves more quickly than usual in a short amount of time and is characterized by variances in range, velocity, and acceleration [11, 16, 17]. In this context, while most earlier investigations utilized Doppler maps to identify falls as a feature of an object’s velocity, the features drawn only from Doppler data are susceptible to detection errors [16, 17]. As a result, recent studies have focused on accounting for features that provide diverse information and then merging them [11, 14–16], since utilizing fused features can increase fall detection accuracy compared to using only single features.
This study proposes a novel method for detecting falls and minimizing false alarm rates using FMCW radar. Range-velocity and range-acceleration maps consisting of complicated information on range, velocity, and acceleration were considered in this study since the information from Doppler maps, although frequently utilized in the past, suffers from multiple limitations when it comes to detecting falls. In each map, two new features— centroid range and range width—were calculated by combining the two features. Notably, centroid range refers to the predicted value of a range weighted by velocity or acceleration, whereas range width indicates the range of distances at which movement occurs over a specific velocity or acceleration. These new features may be considered fusion features, whose variations are influenced by two separate features. The performance of the new features was validated by comparing them to existing features in terms of fall detection accuracy and detection error rate using the most popular machine learning techniques—support vector machine (SVM) and linear discriminant analysis (LDA).
II. FMCW RADAR AND CONVENTIONAL FEATURES FOR FALL DETECTION
1. FMCW Radar Signal Processing
To detect objects, an FMCW radar uses chirp signals, which are sinusoids modulated at a linearly increasing frequency. Notably, the range and velocity of a moving object can be measured by analyzing the demodulated signal generated from the transmitted and received signals. The transmitted signal S[τ] is a chirp signal whose frequency increases linearly, defined in slow time as follows:
where τ is the sample index of the chirp, A is the amplitude of the transmitted signal, fc is the carrier frequency, BW is the bandwidth, and Tc is the chirp duration. Meanwhile, the received signal R[τ] refers to a signal that is delayed by τd, denoting the time taken by the transmitted signal to reflect back to the object, expressed as:
where B is the amplitude of the received signal. Notably, the Doppler frequency fd can be verified in the frequency domain due to the Doppler effect. After undergoing low-pass filtering, the transmitted and received signals were demodulated in the mixer to arrive at the demodulation signal M[τ]. Meanwhile, C refers to the amplitude of the demodulation signal.
To extract features from the frequency and phase domains of the radar signal, the formula for sample τ and chirp n at specific scan t can be expressed as follows:
where C is the amplitude of the signal and fb is the beat frequency, which indicates the difference between the transmission and reception frequencies and equals
B W · 2 r T c · c 4 π f c · T c c
2. Conventional Features
The range and velocity of the object were determined by employing FFT, considering the signal’s frequency and phase information. The range for each scan t was obtained by performing FFT on sample τ using Eq. (4), as shown in Eq. (5). The change in range over time was determined by taking the average of chirp n and displaying it as a range map, as formulated in Eq. (6).
Here, T denotes the number of fast-time samples and N is the number of chirps in one scan. By performing 2D-FFT on chirp n in Eq. (5), which had already been fast Fourier transformed once, the velocity of the moving object for scan t was obtained, as noted in Eq. (7). Subsequently, the Doppler map can be obtained by using the average range to calculate the change in velocity over time, as shown in Eq. (8).
To calculate the scan velocity, the average of the samples was calculated and the Doppler map was displayed, as shown in Fig. 1. Since the received radar signals also contain information on unwanted objects, an moving target indicator (MTI) filter was applied to the Doppler map to eliminate information related to non-moving objects, calculated using the difference in the mean for all data [18].
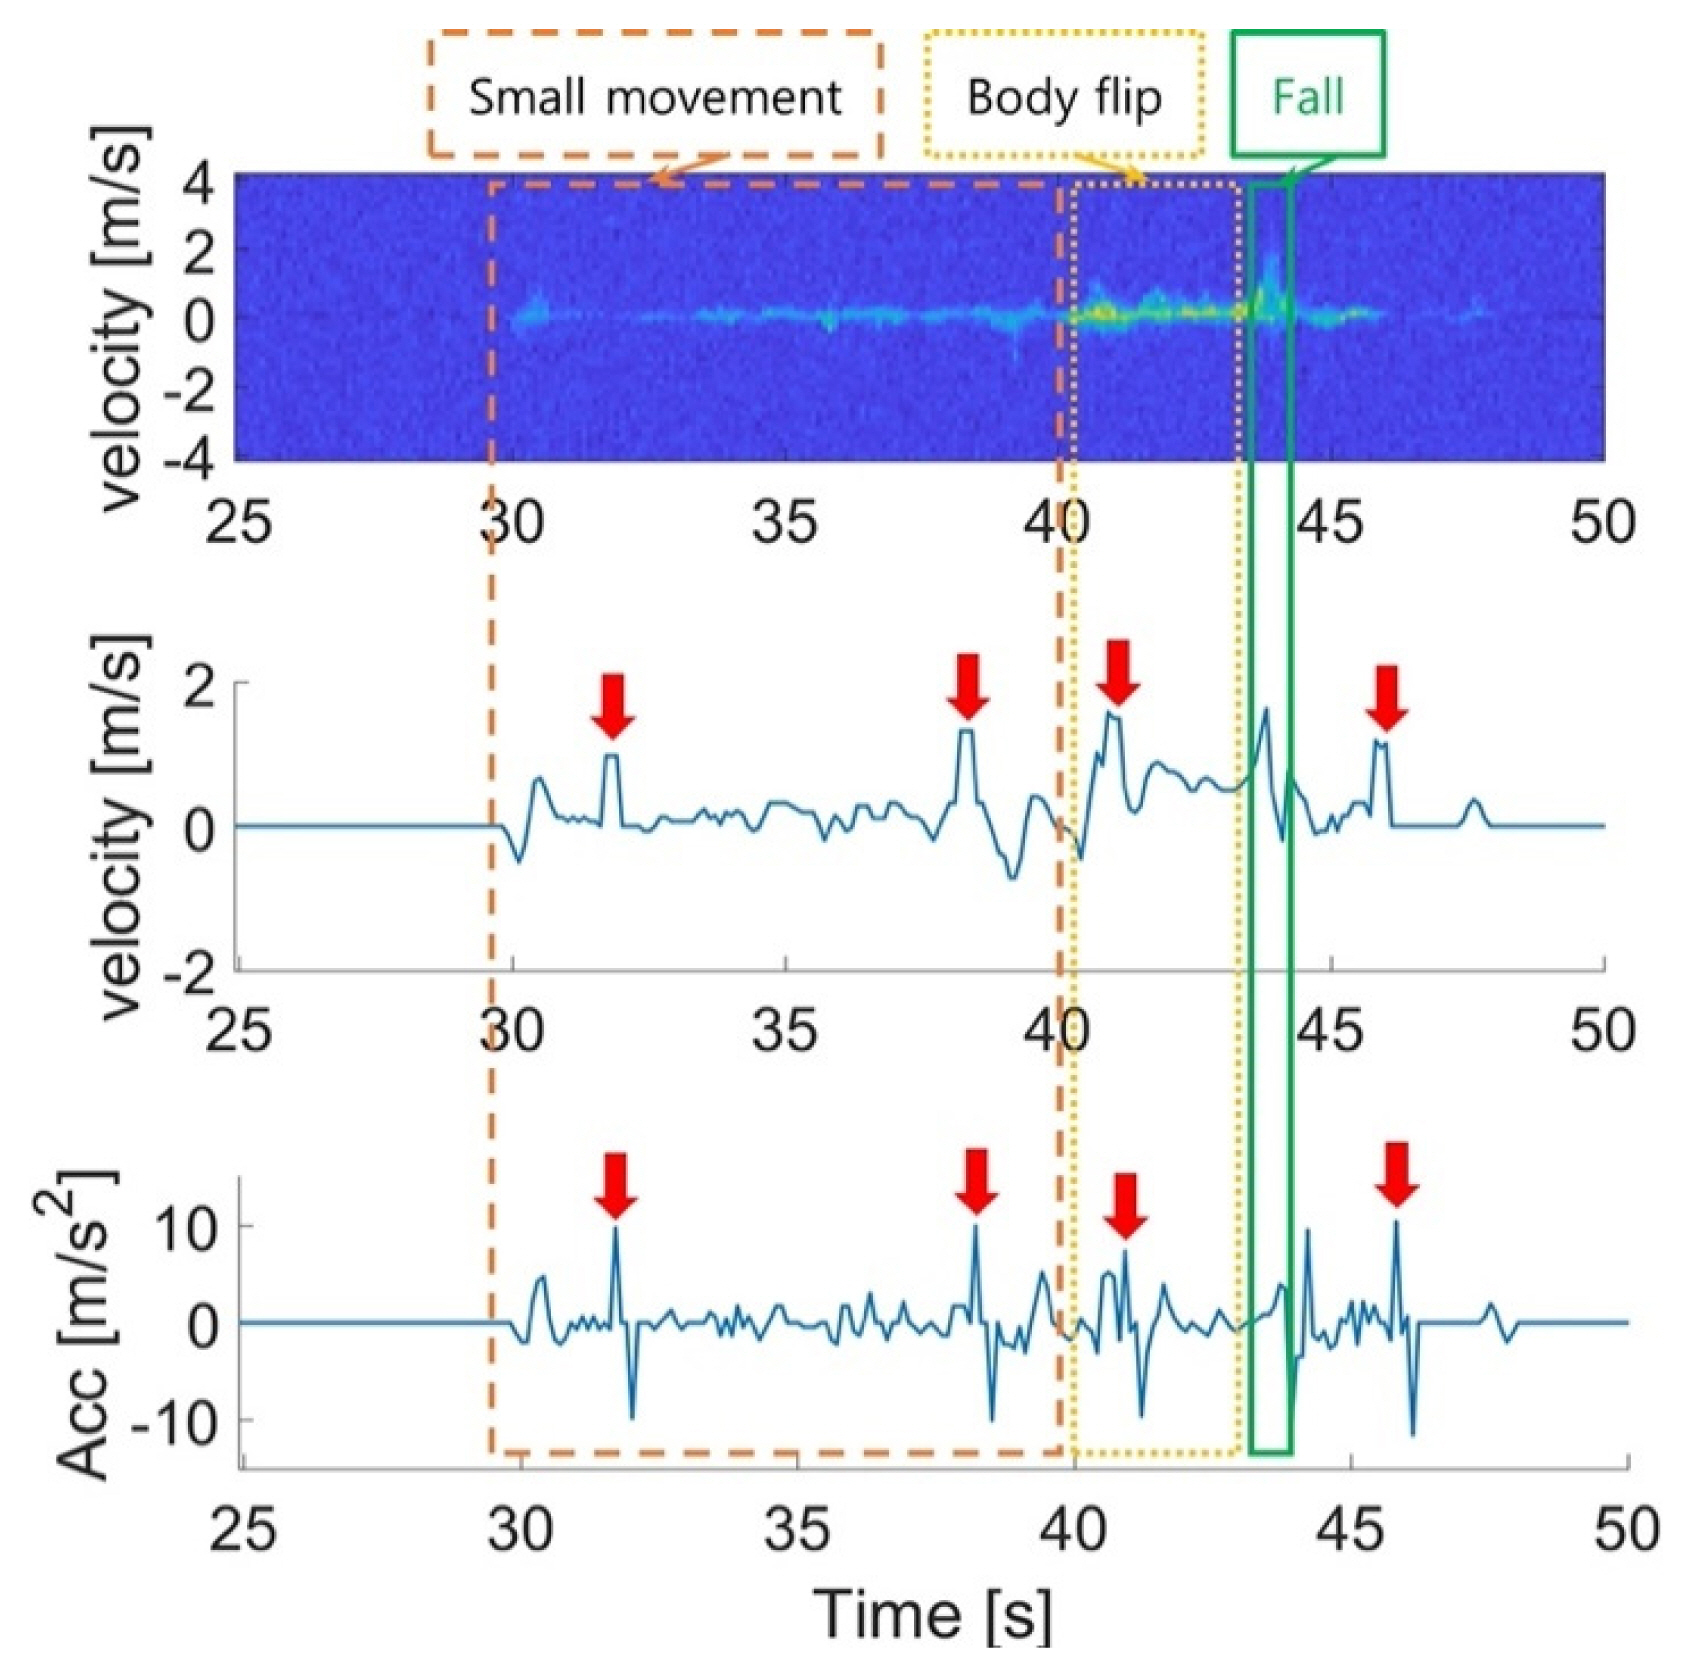
Subsequently, the velocity vext(t) and acceleration acc(t) of the object were calculated from the Doppler map, depicted in Fig. 2, as follows:
Notably, the power threshold used an arbitrarily set value based on the experimental situation. The maximum absolute value of the velocity vk(t) of the filtered Doppler map is shown as Eq. (10), while acceleration acc(t) was calculated using the difference in velocity vext(t) between scans.
Fig. 2 shows a graph depicting the use of radar to detect the falling motion of a person whose body flips while grooming their hair sitting on a bed. As shown in Fig. 2, it is difficult to detect the point of fall using only velocity and acceleration, indicating that detection errors are common since different motions have similar values.
III. PROPOSED FEATURES
This study proposes a range–velocity map representing the range and velocity over time and a range–velocity map representing range and acceleration, calculated as follows:
Here, R denotes the maximum detection range of the radar. The map of time and range, along with the value of the maximum velocity in the Doppler map, was displayed as the range–velocity map Z(t, r). Subsequently, acceleration was obtained using the velocity difference from the range–velocity map and then displayed as a range–acceleration map A(t, r).
By adding range information to the velocity information, as shown in Fig. 3, the movement of the object that was invisible on the Doppler map could now be observed. In other words, this new map enabled the detection of sections in which the velocity and range or the acceleration and range increased simultaneously. To distinguish such a fall, this study proposes two new features—centroid range and range width.
The centroid range is the expected value of a range when velocity or acceleration is weighted. A scan of the range–velocity map expresses the velocity of the object detected at each range in color, indicating the velocity distribution in terms of range.
A fall is an action in which the velocity and acceleration of the body change rapidly. This change in the two features can be determined by calculating the average range while accounting for velocity. From the two new maps, the velocity centroid range rvc(t) and acceleration centroid range rac(t) were calculated, as follows:
Range width refers to the range of distance over which motions with a velocity or acceleration larger than a certain value appear. This study used only the velocity section to minimize the noise of non-moving objects and to determine the range of motion of the displayed objects.
Since a fall changes the range and velocity of the entire body, a wide range must be displayed on the map. Therefore, the range width was calculated using the difference between the maximum and minimum values of the range detected in each scan of the map. Similar to the centroid range, two features based on velocity and acceleration—the velocity range width rvw(t) and the acceleration range width raw(t)—were obtained, as follows:
IV. EXPERIMENT RESULTS
1. New Features Considered under Falling Situations
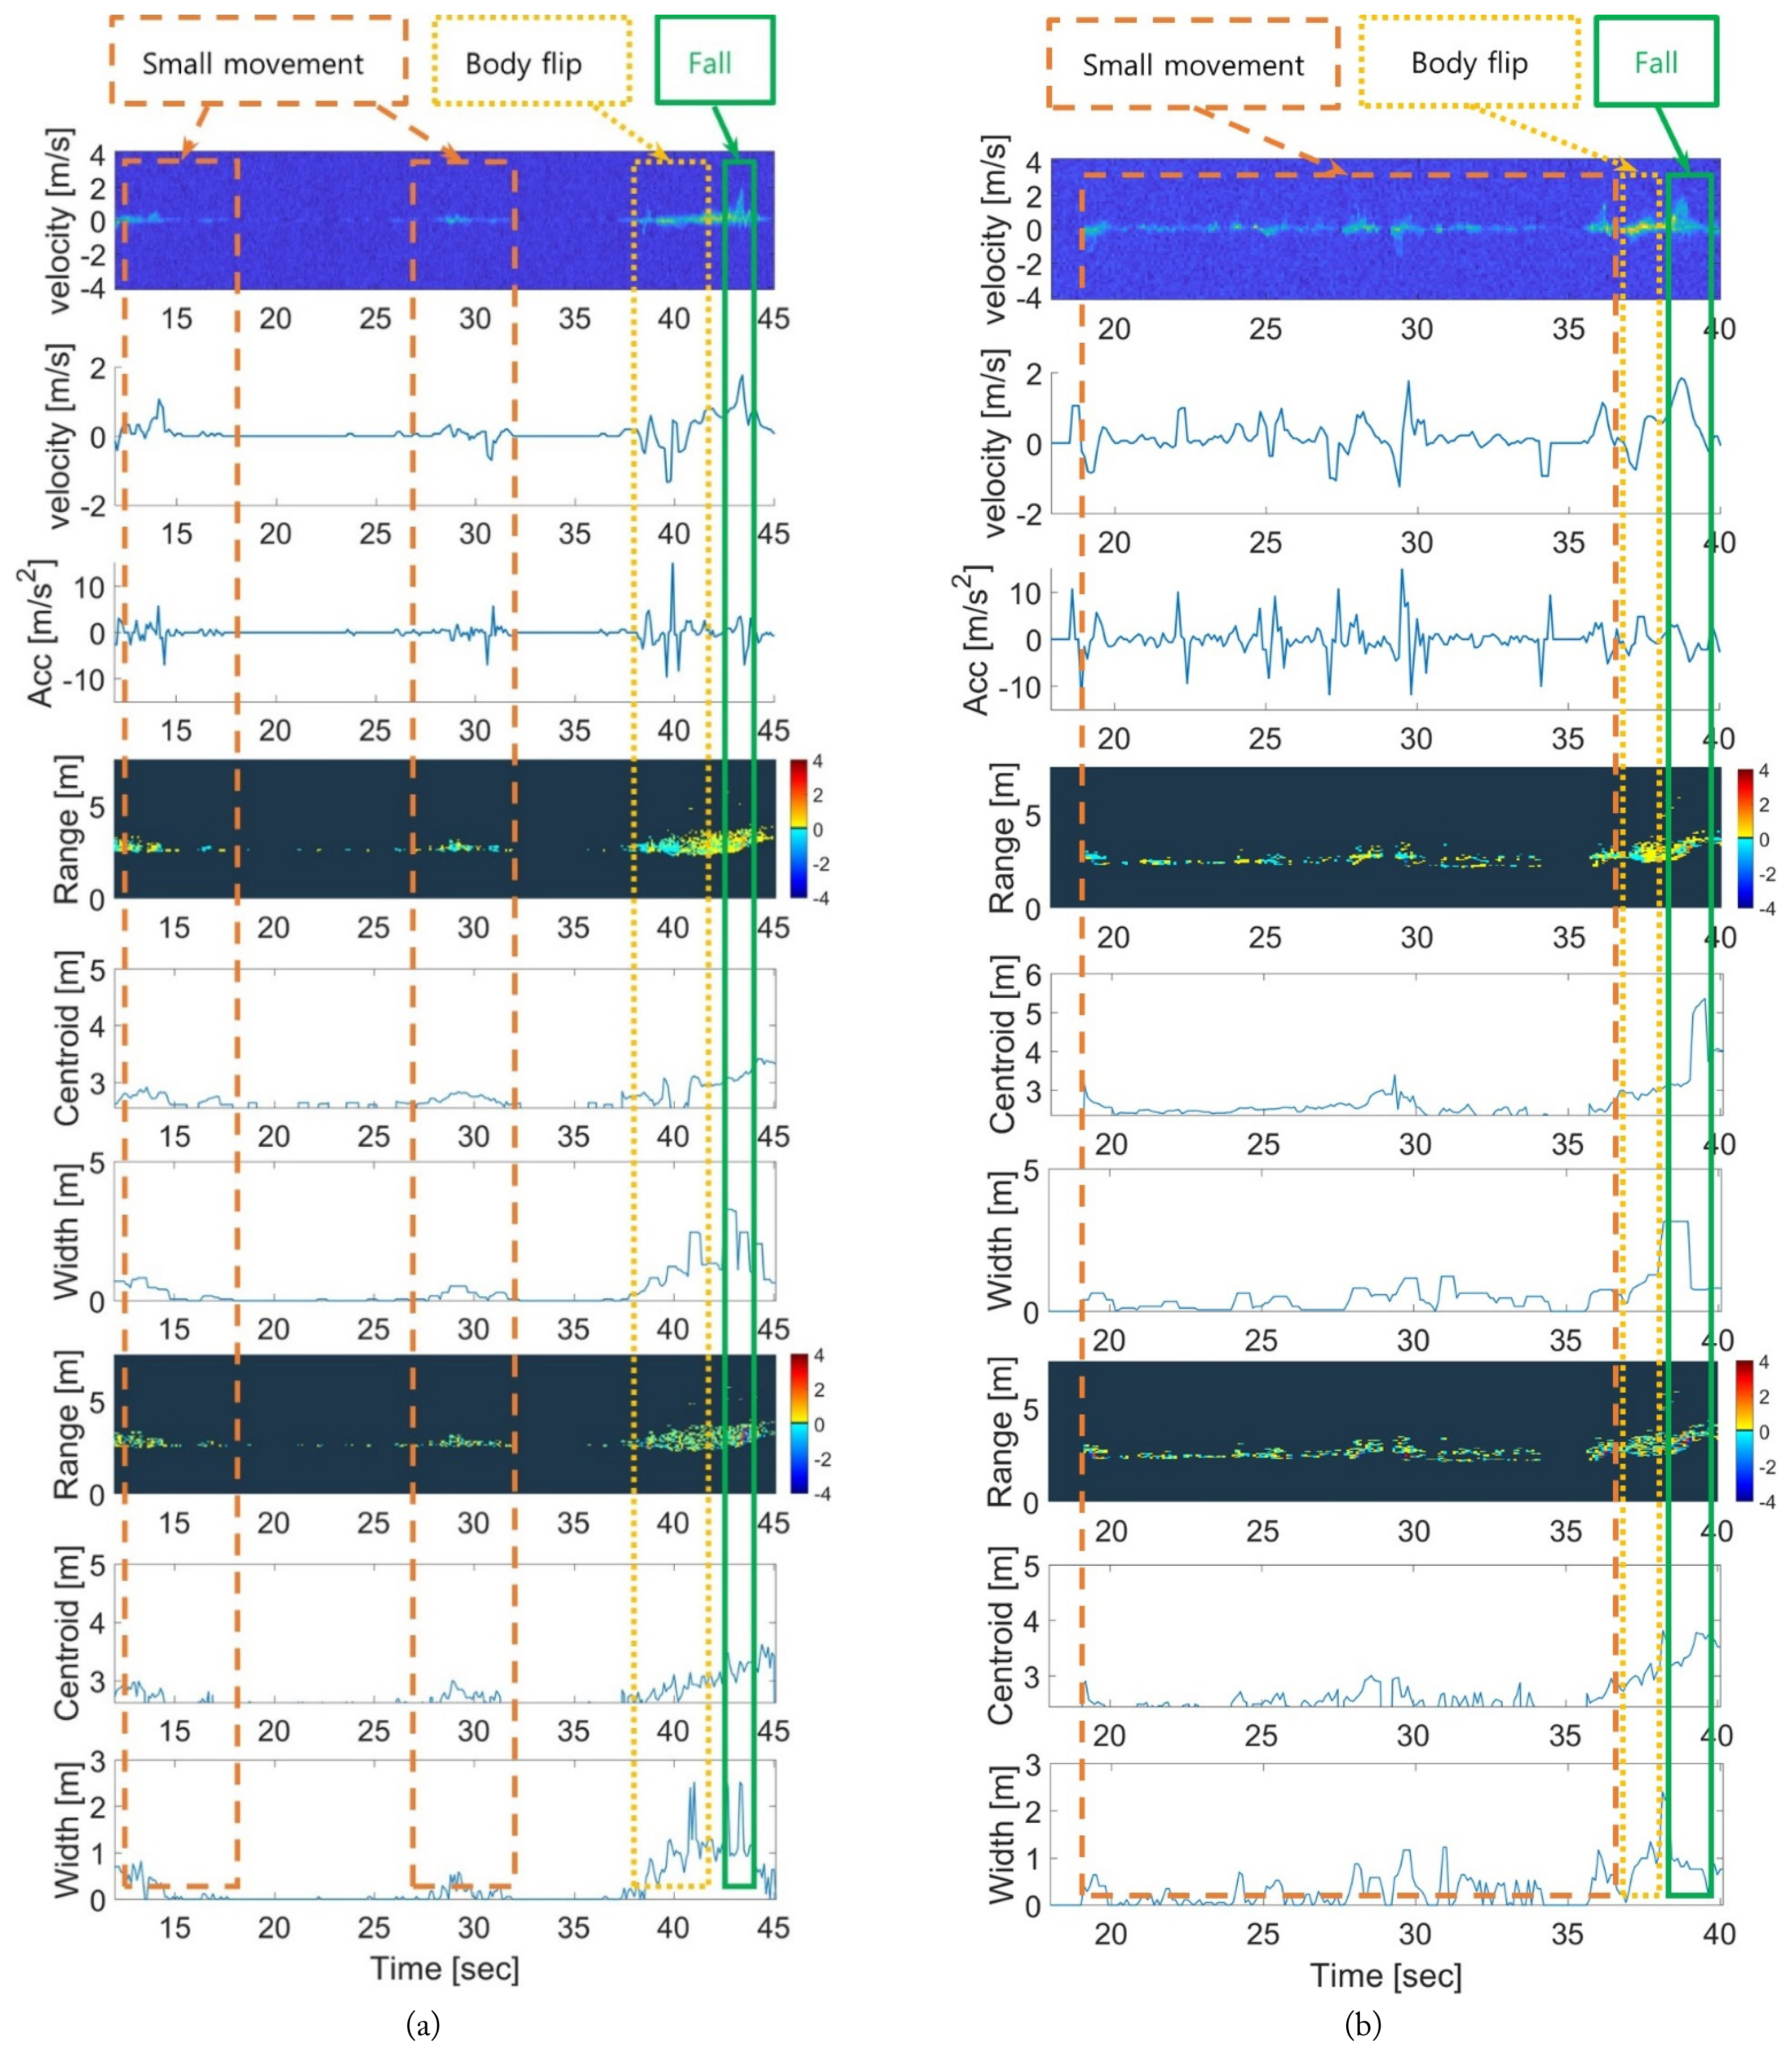
Fig. 2 highlights the points at which detection errors in the velocity and acceleration data were determined for a flipping body and for small movements, such as grooming hair using hands. In this context, Fig. 3 shows that the sections indicating a high risk of detection errors in daily motions have a relatively low value. Fig. 4 presents the results obtained by comparing the values of the old and new features for falls and daily motions using additional examples. All examples were drawn from experimental data, including the body flip and the small movement—grooming hair with hands—before falling. Fig. 4 lists the Doppler map, velocity, acceleration, range-velocity map, centroid range, and range width to compare the difference in values related to the same motion. As observed in the case of conventional features, such as velocity and acceleration, daily motions may be falsely detected as falls. In contrast, in the proposed features, the values of the corresponding interval are more distinct when a fall occurs.
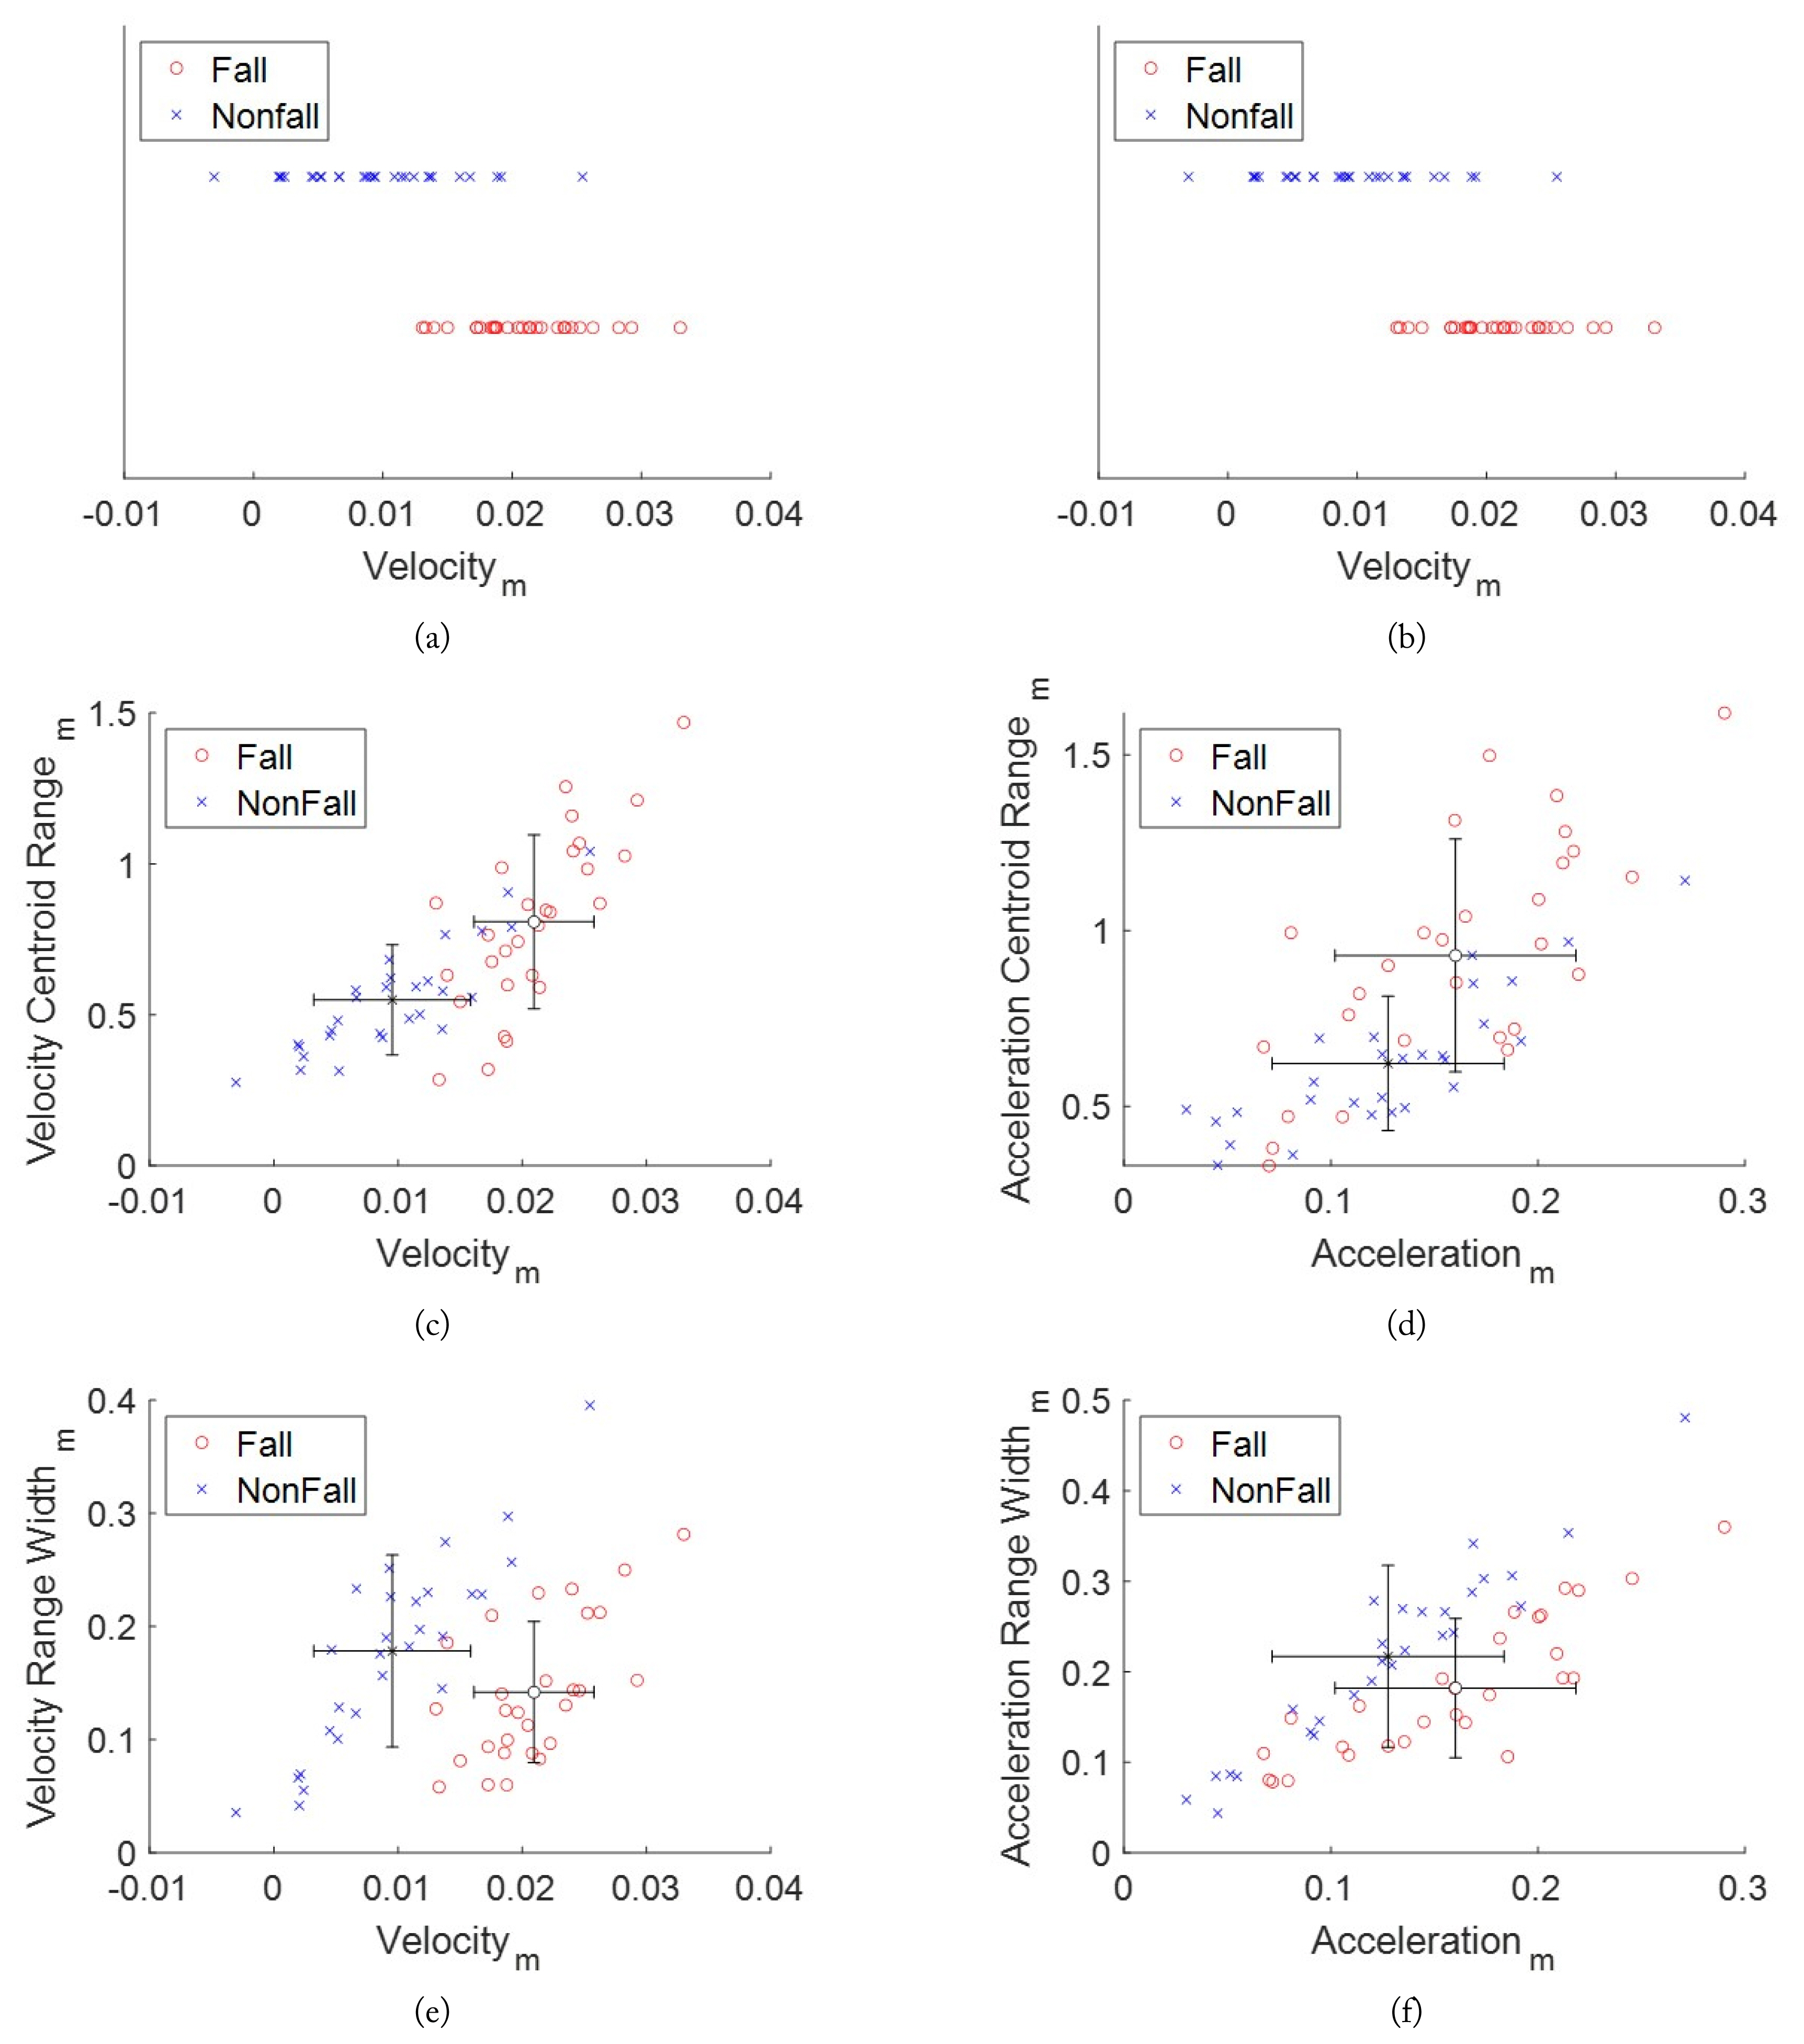
A scatter graph depicting 28 selected falls and daily motion data was plotted, as shown in Fig. 5, to identify the degree of representation of the fall characteristics. In Fig. 5(a) and 5(b), the values of the existing features with regard to motion are listed. To individually verify the data distribution of the motions, they are displayed at different heights on the vertical axis. It is evident that while the values of the falls and daily motions tend to be differentiated when considering velocity, the distribution of values are too similar in the case of acceleration, making it difficult to distinguish them. Fig. 5(c)–5(f) compare the distributions of the new features with those of the existing features for the same motion. Specifically, the mean and standard deviation for each dataset were plotted to distinguish the distributions.
With the addition of new features, including range information, the distribution of falls and daily motions can be easily distinguished. Between the two new features, the centroid range helped identify the characteristics of falls better than the range width, since the range between the averages was larger.
2. Experimental Setup
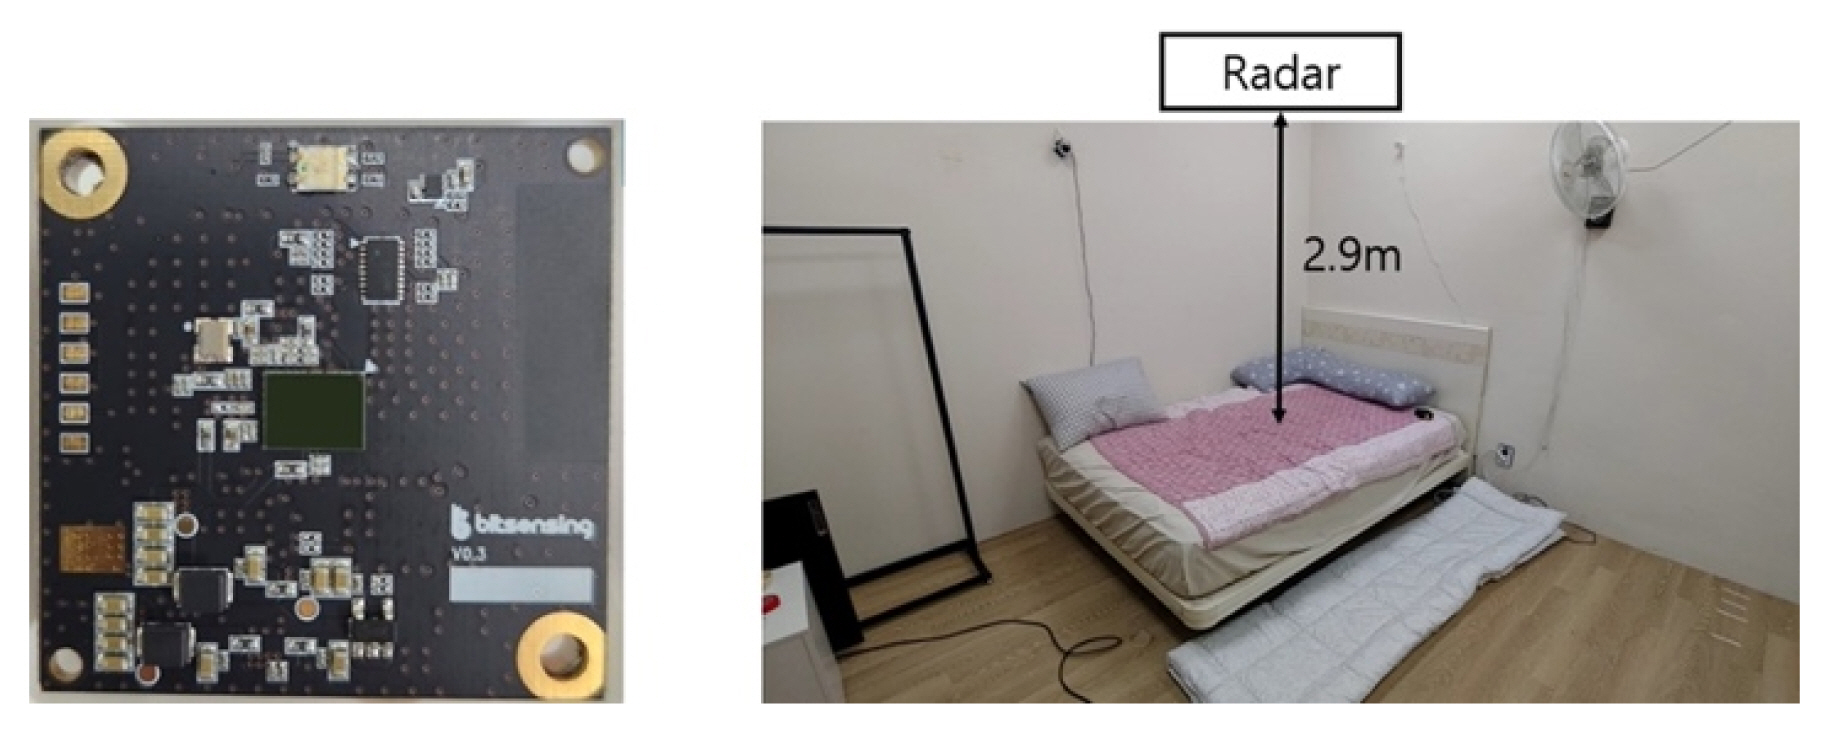
For this experiment, the FMCW radar was mounted on a ceiling situated 2.9 m above the bed to detect motions near the bed, as shown in Fig. 6. The FMCW radar, whose specifications are listed in Table 1, can detect objects located within 0–7.5 m with a velocity of up to 3.9 m/s. To conduct the experiment, five participants aged 25–35 acted as slowly as the elderly. All experiments were conducted with each participant in the same space using the same power threshold. The experimental motions included a fall motion from the bed, as well as five daily motions that could result in detection errors pertaining to a fall. The daily motions—sitting up, sitting at the front of the bed, moving to the end of the bed, sitting at the end of the bed, and standing up from the bed—are depicted in detail in Fig. 7. In this experiment, a fall was considered the motion of falling to the floor while lying in bed, while daily motion was set to denote movement of the torso similar to a fall.
3. Comparison of the Feature Results by Motion
Feature graphs of motions that may cause fall detection errors were generated using the data obtained from the experiment for comparison with the fall data. Fig. 8(a)–8(d) present the experimental data for the daily motions, including sitting up, sitting at the front of the bed, moving to the end of the bed, sitting at the end of the bed, and standing up from the bed, respectively. The intervals in which values similar to a fall in velocity and acceleration appeared were considered the hazard interval for fall detection errors. A comparison of these intervals between the conventional and new features was conducted. Contrary to the results of the fall data, the new features exhibited relatively low values for intervals in which the existing features measured high values. This study, therefore, attempted to reduce fall detection errors using specific characteristics.
4. Results of the Classification Performance Evaluation
The results for the new and existing features were compared using SVM and LDA to determine their classification performance. SVM and LDA are machine learning techniques—the former sets the criteria for classifying data belonging to the same category, and the latter classifies data linearly by reducing its dimensionality. Both methods are simple and popularly used for classifying fall detection [18]. In this paper, SVM used the linear kernel, with the cost parameter C being 1, while LDA considered two classes—fall and daily motions. As classification data, 21 fall data and 141 daily motion data were utilized, with the training and testing datasets used at a 6:4 ratio. The correct answers and results predicted by the classifier are presented in the confusion matrices in Fig. 9, where true positive (TP) and true negative (TN) represent the number of correct detections, while false positive (FP) and false negative (FN) indicate the number of false detections. To evaluate the classification results using the matrix, four evaluation metrics (i.e., accuracy, precision, recall, and F1-score) were calculated, as follows:
Accuracy is the percentage of cases correctly predicted as true and false, precision is the percentage of correct answers that the model classified as true, recall is the proportion of actual correct answers that the model predicted to be true, and the F1 score is the harmonic mean of precision and recall.
Fig. 9(b)–9(e) present the confusion matrix results for the existing and new features. Table 2 shows the SVM and LDA results obtained using the two existing features, as well as the six existing and new features. In most cases, the performance improved when the new features were added. For instance, excluding precision, all evaluation metrics exhibited the highest results in the classification method that considered the new features. Among the evaluation metrics for the existing features, recall displayed low performance. However, when new features were added, the performance increased significantly, proving that the new features were effective in resolving fall detection errors.
V. CONCLUSION
This study aimed to detect falls and reduce detection errors using FMCW radar. While range maps and Doppler maps have been widely used in the past for this purpose, they depict only a single feature, thus increasing the probability of fall detection errors. Addressing this shortcoming, this study proposes new features that account for complex information using range-velocity and range-acceleration maps. These new features are the centroid range and range width—factors that have never been considered in FMCW radar systems, even for other applications. A scatter plot was drawn using experimental data on falls and daily motions to verify the distinction between the existing and new features. The data were classified using SVM and LDA, after which the classification performance was compared using four evaluation metrics—accuracy, precision, recall, and F1-score. When considering the new features, all the evaluation metrics exhibited their best performances, except for precision. The increase in recall, which represents the proportion of actual correct answers predicted by the model to be true, proved that the new features were effective in resolving detection errors. The proposed features can be expected to increase fall detection rates and prevent mishaps caused by the alarm not sounding even when an actual fall occurs. However, this paper considered only one type of fall motion—the most popular fall behavior observed in conventional research. Since different types of fall motions other than the one considered in this paper may also occur, future studies must focus on accounting for them to ensure accurate detection.