J. Electromagn. Eng. Sci Search

CLOSE


J. Electromagn. Eng. Sci > Volume 24(3); 2024 > Article
Wu, Zhao, Wang, Su, and Cheng: ISAR Image Registration Based on Line Features

Abstract

Inverse synthetic aperture radar (ISAR) image registration enables the analysis of target dynamics by comparing registered images from different viewpoints. However, it faces significant challenges due to various factors, such as the complex scattering characteristics of the target, limited availability of information, and additive noise in ISAR images. This paper proposes a novel ISAR image registration method based on line features. It integrates information from both dominant scatterers and the target’s outer contour to detect lines. According to the consistency principles of multiple lines in rotation and translation, line features from different ISAR images are matched. Simultaneously, the results of the feature matching are utilized to guide the parameter configuration for optimizing the image registration process. Comparative experiments illustrate the advantages of the proposed method in both feature extraction and registration feasibility.

I. Introduction

Inverse synthetic aperture radar (ISAR) plays an important role in space target observation and recognition by providing two-dimensional images of targets in all kinds of weather, as well as in day and night conditions [1]. ISAR image registration enables the analysis of target performance and behavior. By comparing the registered images from different views, researchers can monitor changes in the target’s structure, track its movements, and study its dynamics. This information is valuable for understanding the target’s capabilities, mission objectives, and operational patterns.
There are many methods for optical image registration and synthetic aperture radar image registration, such as normalized cross-correlation (NCC) [2], scale invariant feature transform (SIFT) [3], speeded up robust feature (SURF) [4], and a plethora of emerging deep learning methods [5]. However, it is difficult to migrate these methods directly into the ISAR field due to the different imaging mechanisms and imaging scenarios involved. The main differences can be summarized as follows:
· Limited information in ISAR images: Unlike optical images characterized by rich texture and gradient information and SAR images with richly detailed scenes, ISAR images usually involve several scatterers on a manmade target. In ISAR images, the most significant information is typically related to the brightness or reflectivity of the target, which is represented by the amplitude of the scatterers in an image.
· Low signal-to-noise ratio (SNR) in ISAR images: The complex electromagnetic scattering characteristics of the target, radar system errors, and translation compensation errors involved in practical imaging degrade image quality and reduce image SNR.
Research on ISAR image registration has mainly focused on the processing of three domains: signal, frequency, and image. Kang et al. [6] proposed a method for ISAR image registration in the signal domain, using raw echo data from different receive antennas to estimate the time-varying angular motion and compensate for the jointly translational motion to ultimately align the range and cross-range directions. Tang et al. [7] used the Fourier-Merlin transform to carry out phase conjugate multiplication in the frequency domain based on the Fourier theorem to achieve ISAR image registration. Furthermore, Gao et al. [8] utilized the correlation coefficient as a similarity measure to estimate alignment parameters. Meanwhile, Adel et al. [9] combined SIFT [10] and SURF [11], based on point features, to achieve image registration. However, in these methods, some meaningless noise points are often extracted as feature points, resulting in unstable performance. Since most space targets feature linear structures (e.g., solar panels and rectangular cavities), line features can be used to solve this problem, since they are more reliable and are less affected by the glinting or defocusing caused by scatterers.
There are many ways in which lines can be detected. The Hough transform (HT) [12] is a popular line detection technique that converts image space into parameter space, where lines are represented as points. However, it is computationally expensive and sensitive to parameter settings. Almazan et al. [13] proposed a probabilistic algorithm to detect lines and thereby improve the sensitivity of parameters, but it required large labeled datasets. Line segment detection (LSD) [14] is another commonly used method for line detection that is based on gradient information that does not rely on HT. Line segment merging (LSM) [15] is an upgraded version of the LSD that applies additional post-processing steps to merge overlapping line segments or remove redundant ones. Notably, line detection is often preceded by contour extraction, which helps segment foreground objects from the background, allowing for more accurate and focused line detection. However, the discontinuity and defocusing caused by scatterers in ISAR images may lead to the extraction of only a coarse contour, which can in turn degrade the performance of the line detection algorithm and lead to large errors in the registration results.
This study proposes a line feature-based ISAR image registration method that exhibits enhanced robustness against image degradation caused by noise, secondary reflections, and system errors. The proposed registration process involves line feature detection, feature matching, and parameter estimation. In particular, feature matching is accomplished by utilizing the spatial relations of line features between the reference image and the sensed image. Furthermore, the registration parameters are estimated by minimizing the sum of the Euclidean distances between the line features. Additionally, the accuracy of line detection in the LSM is improved by employing relevant techniques, such as image enhancement, contour extraction, and scatterer fitting. Moreover, the efficiency of parameter estimation is optimized by implementing the Snake Optimization (SO) [16] algorithm, which dynamically adjusts its search strategy and parameters, demonstrating solid capabilities in global exploration, robustness, and adaptability.
The remainder of this paper is organized as follows: Section II analyses the transform model for ISAR images from different perspectives, Section III introduces the proposed line feature detection and matching method, Section IV demonstrates the parameter estimation process of the ISAR image registration method, Section V provides the different experimental results to validate the efficacy of the proposed method, and Section VI presents the conclusions of this study.

II. Registration Model of ISAR Image Sequences

This section of the study uses a monostatic scenario as a reference point to analyze the relationship between the different viewpoints of ISAR images.
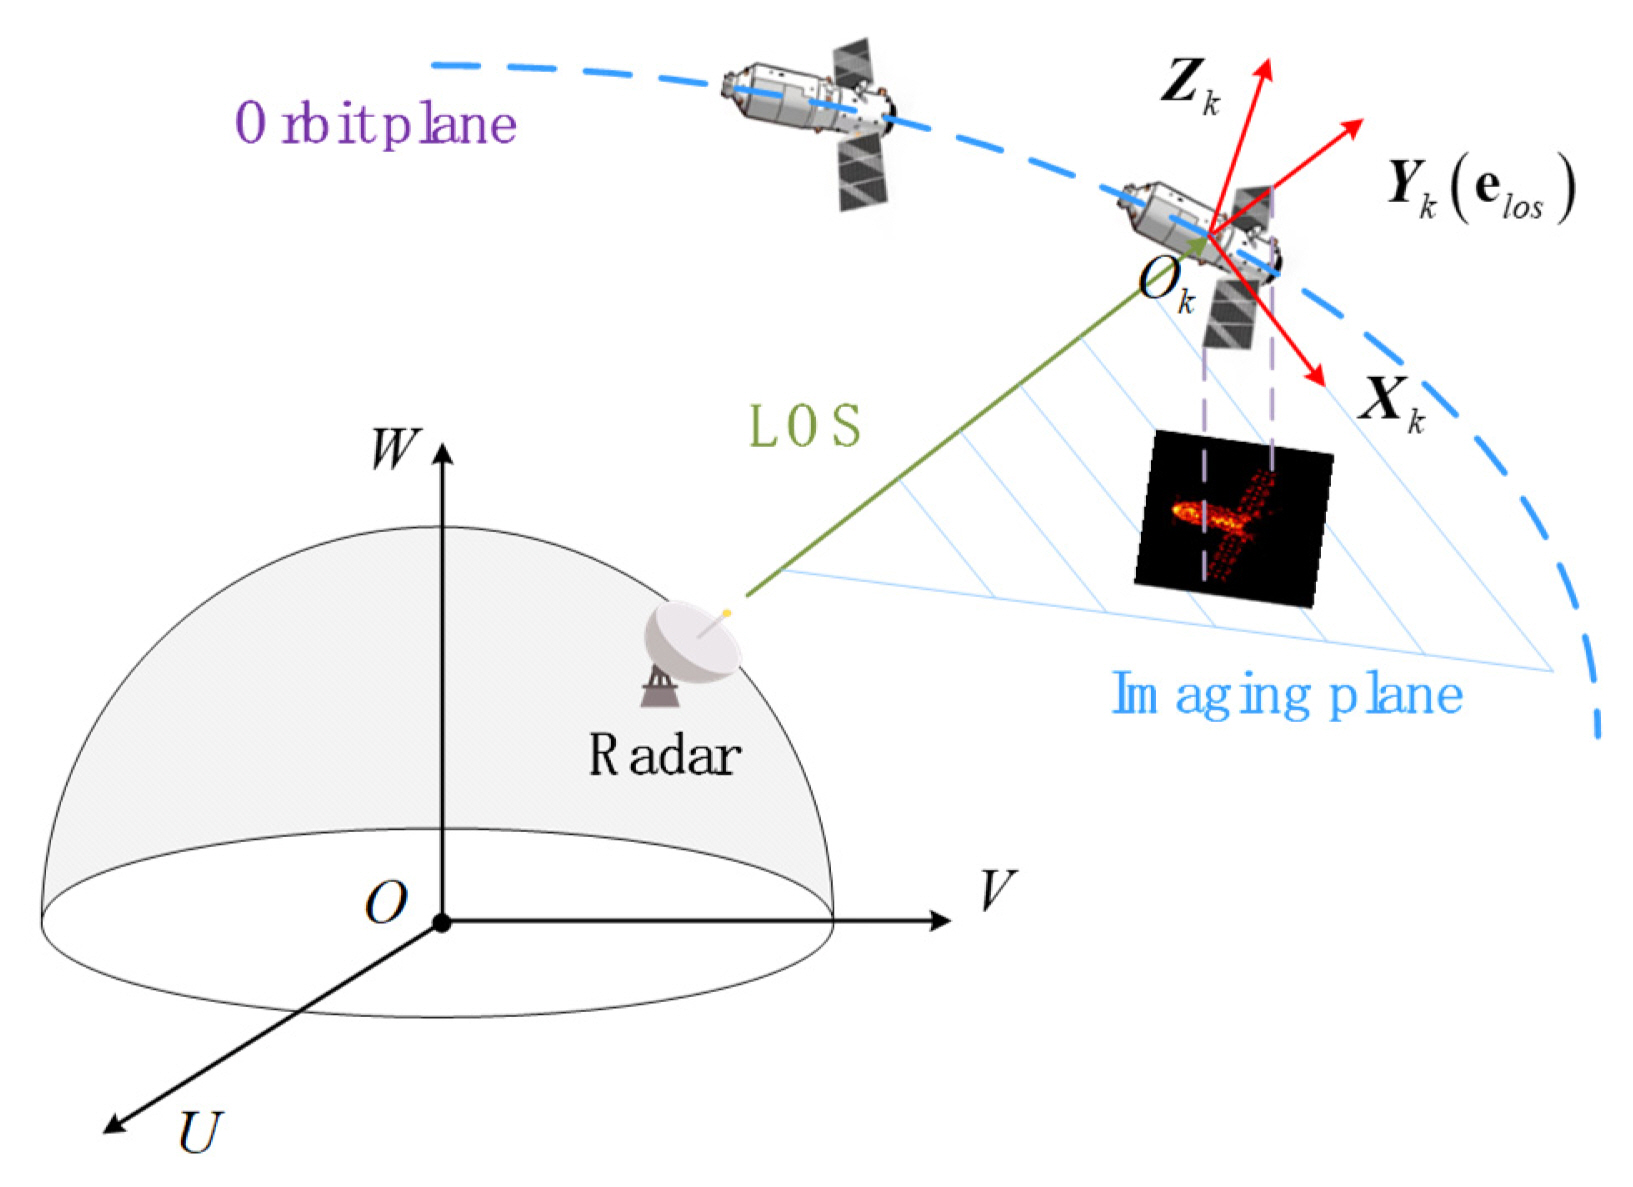
The ISAR imaging geometry is depicted in Fig. 1, where TUVW represents the inertial coordinate system and TXkYkZk is the imaging coordinate system at the k-th moment. Furthermore, Xk and Yk represent the Doppler and range axes of imaging, respectively. Zk is the normal vector of the imaging plane and elos stands for the unit vector from the radar to the target. Notably, the relative motion of the targets with respect to the radar can be divided into translation and rotation. Translation must be compensated for before azimuth compression [17], while rotation is usually retained for ISAR imaging. Assuming ωlos represents the line of sight (LOS) rotation and ωtar refers to the target self-rotation, the effective rotation vector can be formulated as:
(1)
ω=elos×[(ωtar+ωlos)×elos].
Furthermore, assuming translation compensation [18] is complete, the target motion can be considered equivalent to an ideal turntable model at a coherent processing time, as shown in Fig. 2.
On considering the coordinates of scatterer Q on the target at the initial time as (x0, y0) and the range of the target center as ROk, the instantaneous distance of Q from the radar can be approximated as:
(2)
R(t)-y0cos (ωt)+x0sin (ωt)+ROk.
Here, c denotes the speed of light, B is the bandwidth, ω refers to the effective target speed, and the coherent processing time is tobs. Furthermore, the range resolution is ηr = c/2B and the azimuth resolution is ηa = λ/2ωtobs. According to the range-Doppler image algorithm, the position of Q relative to the center of the ISAR image can be obtained as follows:
(3)
Y(t)=-R(t)-ROkηr,
(4)
X(t)=1ηadR(t)dt.
Substituting Eq. (2) into Eqs. (3) and (4), the coordinates of Q in the image can be rewritten in the form of the following matrix:
(5)
[X(t)Y(t)]=[cos (ωt)-sin (ωt)sin (ωt)cos (ωt)]R[x0/ηay0/ηr].
Furthermore, on considering the image I1 corresponding to t1 as the sensed image, and the image I2 corresponding to t2 as the reference image, the position relationship of scatterer Q in these two images can be expressed as:
(6)
[X(t2)Y(t2)]=R(t2)R-1(t1)[X(t1)Y(t1)]=[cos γ-sin γsin γcos γ][X(t1)Y(t1)],
where γ = ω(t2t1).
However, offsets between images might still remain because of the errors introduced during the delay and the compensation process [19]. Therefore, supposing that the relative offset vector of the centers is p = [a, b], the transformation matrix can be expressed as:
(7)
[X(t2)Y(t2)1]=[cos γ-sin γasin γcos γb001][X(t1)Y(t1)1]=[Rγp01][X(t1)Y(t1)1].
The relationship between the same lines in the two images can be obtained in the same way. In this context, it is worth noting that, due to target scattering properties, noise, and low image quality, it is difficult to accurately determine the length of the lines. To address this, the direction angle and the vertical distance from the origin of the image to the line were utilized to describe a line, namely L = [ρ, θ], as shown in Fig. 2. Therefore, the position vector, which indicates the vertical distance vector from Ok to line L, can be formulated as:
(8)
r=[-ρsin θρsin θ]T.
Notably, the direction vector of line L is:
(9)
n=[cos θsin θ]T.
Therefore, the relationship between line L in the two images can be expressed as follows:
(10)
[r2-pn2]T=Rγ[r1n1]T,
where r1 and n1 represent the position vector and direction vector in image I1, respectively, while r2 and n2 denote the position and direction vectors in image I2.

III. Line Feature Detection and Matching

ISAR images are collections of points, with the edge of the images being discontinuous. As a result, traditional automatic feature extraction methods present considerable challenges for ISAR images. In this section, the LSM algorithm is improved upon to extract line features from ISAR images, thus aiding in the subsequent image registration process.

1. Image Preprocessing

Preprocessing, such as image enhancement and edge detection, is often necessary to improve the robustness of line detection.
Considering that ISAR images are characterized by the presence of several strong scatterers, the weak scatterers in the images may become less distinguishable. To address this issue, the contrast of the ISAR images used in this study was adjusted to enhance the visibility of weak scatterers, thereby preserving more target details. In addition, morphological image processing methods [20, 21] were implemented to connect adjacent points and obtain a complete contour. Finally, the outer contour [22] was extracted utilizing a typical edge detection operator, Canny [23].
Although the outer contour exhibited gaps or deviations from the natural target boundary, possibly resulting from the alterations caused in the target’s area during the dilatation process, it was still able to offer valuable indications regarding the spatial position of the lines.

2. Line Detection

LSM is well known for its efficiency and accuracy. The LSM process primarily comprises scale-space analysis, gradient calculation, line support region estimation, line validation, line pruning, and line mergence. Notably, the possibility of LSM will be further investigated in the experimental section of this study. In this paper, the outer contour image was used as the input for the LSM to extract coarse line features L = [ρ, θ].
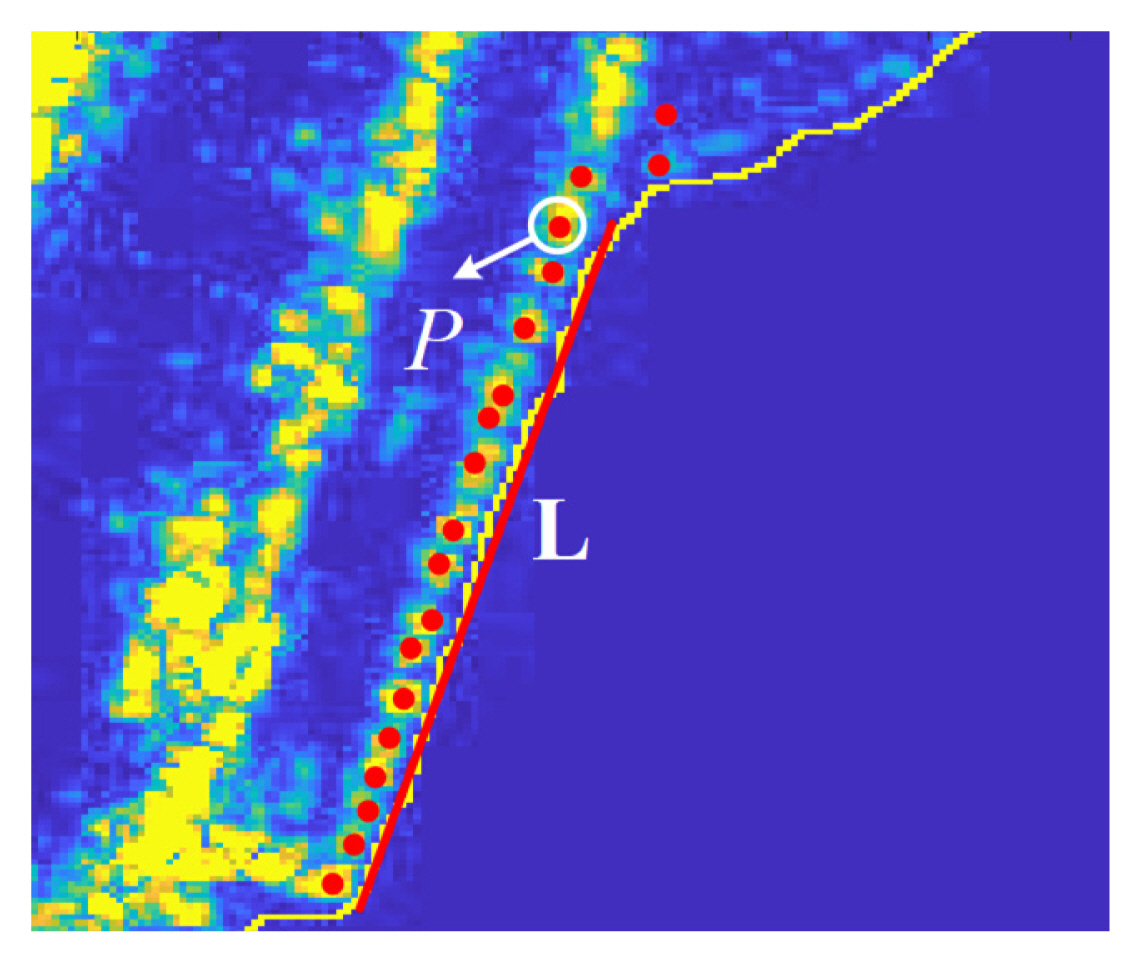
In this context, it should be noted that during the course of this process, the outer contour errors were transmitted into the line errors. For example, the LSM result presented in Fig. 3 exhibits a gap between the LSM results and the natural edge of the target. To address this problem, the CLEAN technique [24] was employed to pick up dominant scatterers from the entire image and filter the scatterers located close to L = [ρ, θ]. Following this, the discrete scatterers were fitted to improve the accuracy of the LSM results. The following is a detailed description of the process adopted in this study for filtering scatterers and calculating line parameters.
Assuming Pj(xj,yj) is the j-th dominant scatterer of the target and Lh = [ρh, θh] is the h-th line feature, the distance between Pj and Lh can be estimated using the following equation:
(11)
dj,h=|tan (θh)xj-yj+ρh1+tan2(θn)|1+tan2(θh).
To calculate the distance between scatterer Pj and the other lines, and obtain an H-dimensional vector, dj = [dj,1, dj,2, … , dj,H], , where H denotes the number of lines. Subsequently, the association of Pj with a specific line can be determined based on an appropriate threshold ɛd = σ|η1η2|, where η1 and η2 are the dilation parameters involved in image preprocessing. Notably, σ can adjust the threshold value to affect the sensitivity of the association. If min (dj) ≤ ɛd, Pj is considered to belong to the associated line, or it is excluded otherwise. Notably, the index of min(dj) represents the line located closest to Pj.
After classification, the dominant scatterers in the same group can be linearly fitted. Assuming there are W points in the h-th group, with each point e represented as (xw, yw), the corresponding coefficient matrix after fitting will be:
(12)
Fh=[xw2xwxwW]-1[xwywyw].
Subsequently, the fitted line Lh = [ρ̃h, θ̃h] can be obtained. Furthermore, the parameters ρ̃h and θ̃h can be formulated as:
(13)
ρ˜h=|yj-Fh(1)xj-Fh(2)|1+[Fh(1)]2,
(14)
θ˜h=arctan [Fh(1)].

3. Line Feature Matching

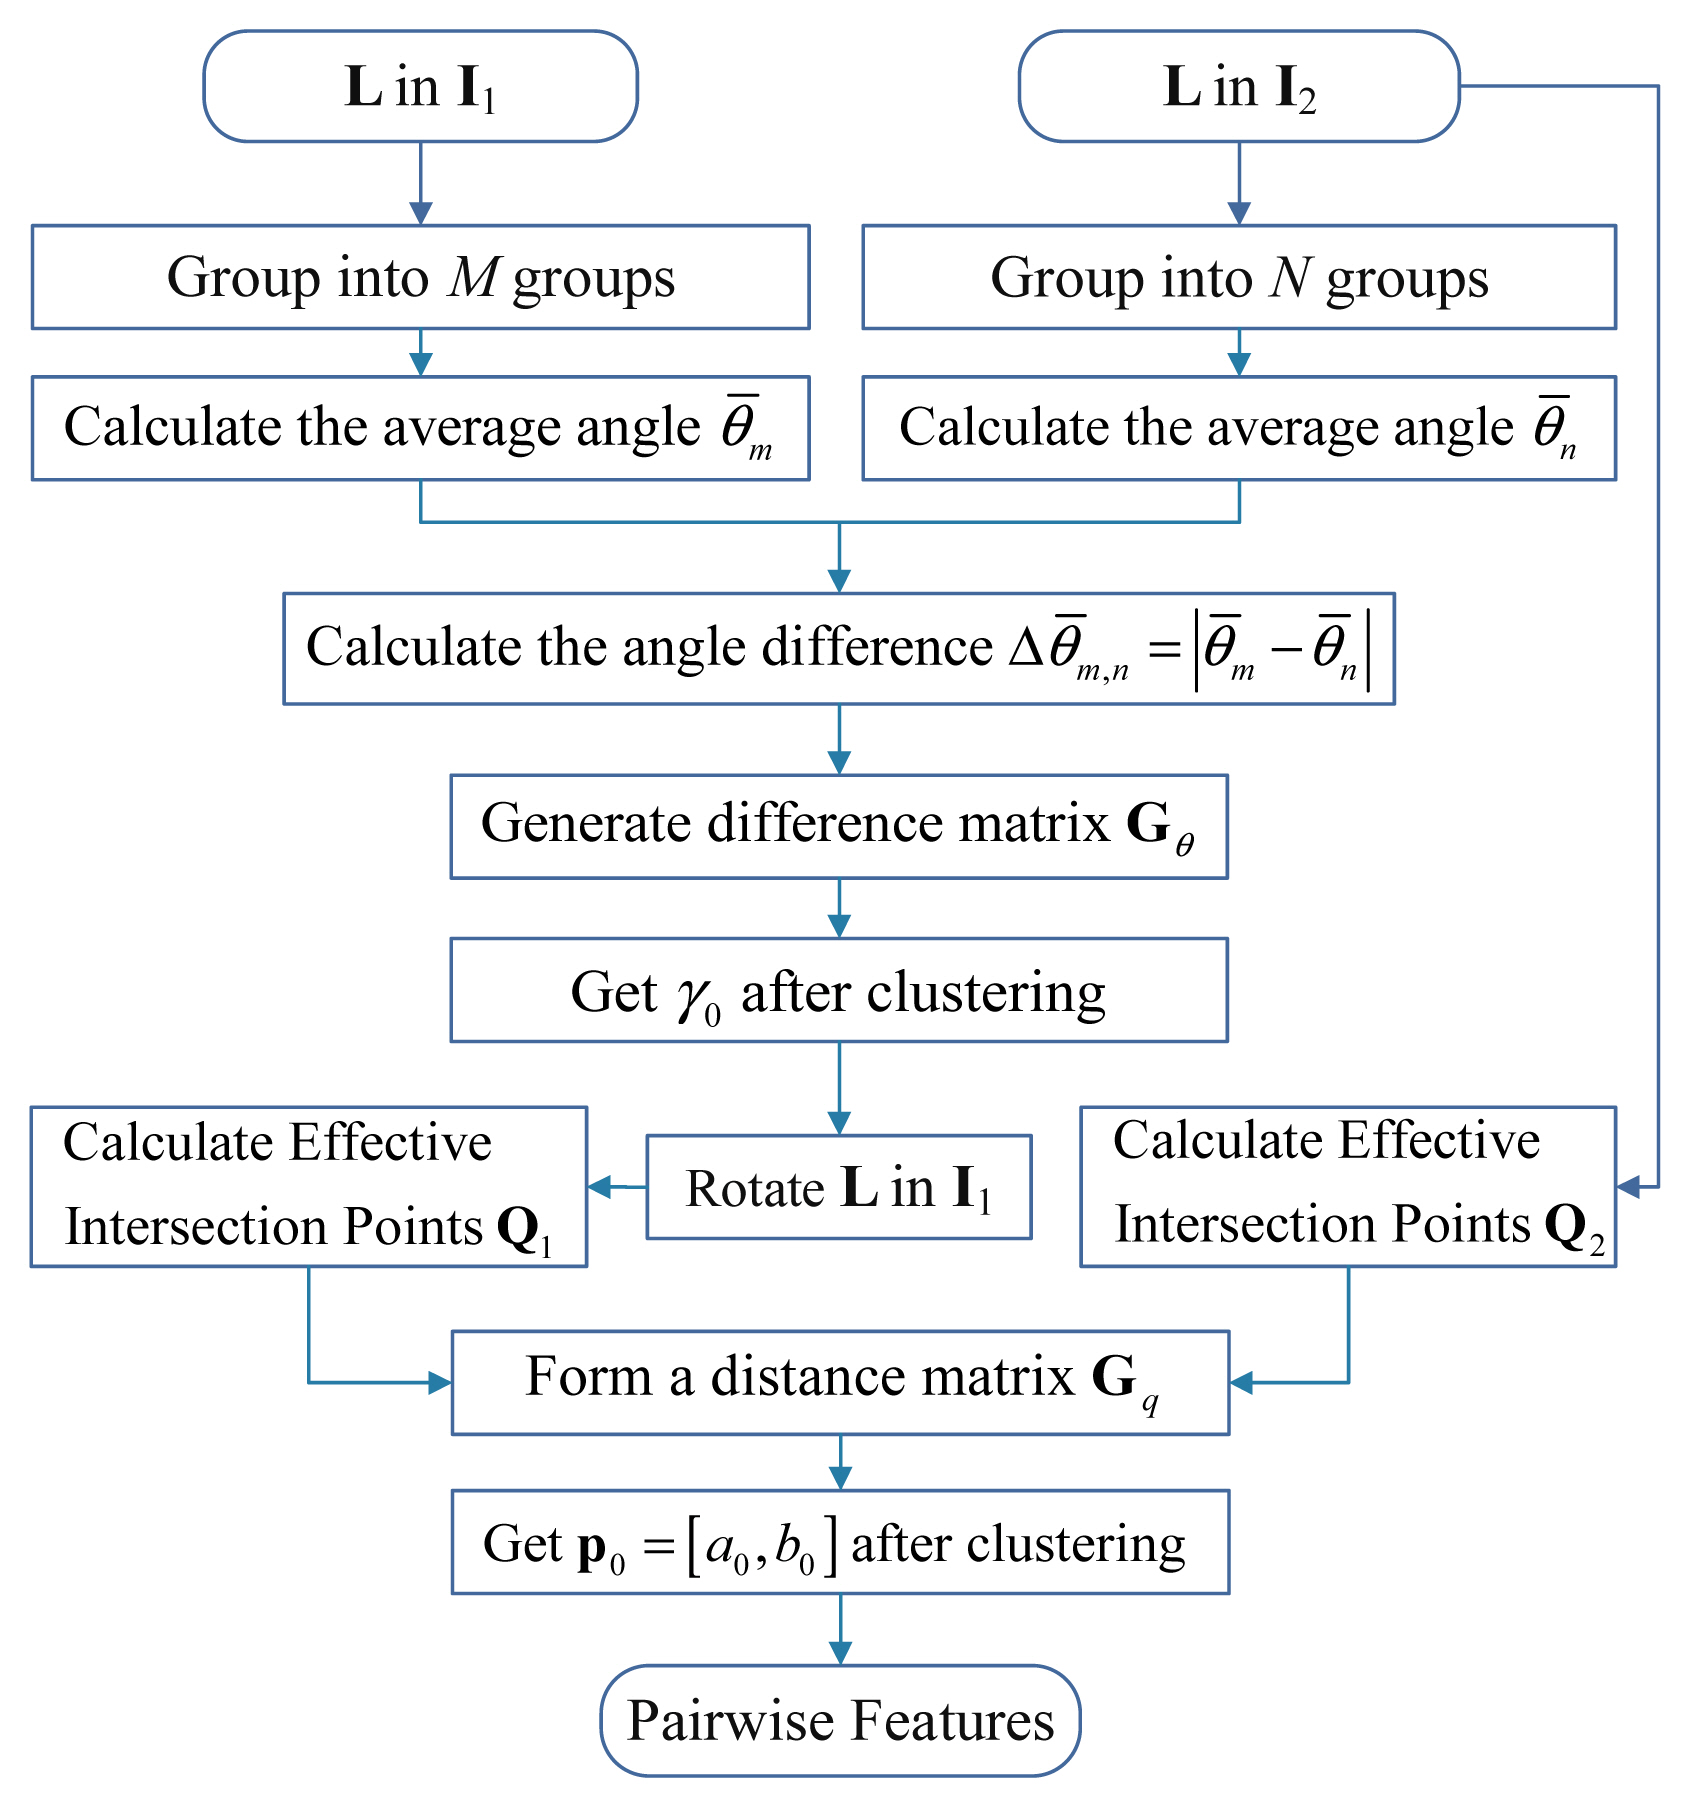
In image registration, establishing a corresponding relationship between line features is a primary task. For this purpose, the current study implemented a novel feature matching strategy to identify corresponding lines between two images based on geometric constraints. The initial stage of this feature matching process involved grouping based on angle information, while subsequent stages focused on matching the lines within the same group by ensuring consistency in the distance between them. The details of this process are as follows:
  • Step I: Categorize the lines with similar orientations into groups based on their angle parameters θ. For instance, assume that I1 (the sensed image) and I2 (the reference image) are divided into M and N groups.

  • Step II: Calculate the average angle of each group to attain θ̄m, where m ∈ [1,2, … , M].

  • Step III: Calculate the angle difference Δθ̄m,n = θ̄mθ̄m| between each group of I1 and I2. Store Δθ̄m,n in a M×N matrix Gθ.

  • Step IV: Analyze the statistical properties of Gθ and identify the correct match with the highest vote rate by applying a clustering algorithm. Then identify the approximate rotation parameter γ0.

  • Step V: Rotate I1 using γ0 as Ĩ1.

  • Step VI: Determine the intersection point of any two lines in the same image. Assuming qi,j is the intersection point of Li and Lj, the coordinates (Xqi,j, Yi,j) of qi,j can be calculated as follows:

(15)
Xai,j=-ρj1+tan2(θj)+ρi1+tan2(θi)tan (θj)-tan (θi),
(16)
Yai,j=ρjtan (θj)1+tan2(θi)-ρjtan (θi)1+tan2(θj)tan (θj)-tan (θi).
Remove any intersection points falling beyond the range of image I1 and store the remaining intersection points in the set Q1. Similarly, generate Q2 for image I2.
  • Step VII: Choose one point from each point set (Q1 and Q2) to calculate the distance vector formed by the two points. Record the distance vectors to create a matrix Gq while iterating through all the intersection points.

  • Step VIII: Perform cluster analysis on the distance vectors in Gq to identify the most frequent occurrences, ultimately completing the line matching.

After correctly matching the intersection points, the average distance vector of the intersection point pairs can be approximated as the translation vector p0 = [a0, b0] between two images.
The key steps of the feature matching process are presented in the flowchart depicted in Fig. 4.

IV. Parameter Estimation based on Line Features

This section presents the results achieved using the SO algorithm to estimate the image registration parameters. Taking γ0 as the initial rotation angle and p0 = [a0, b0] as the initial translation vector, the angle, range, and cross-range offset can be defined as Δγ, Δa;, and Δb. Therefore, the refined values can be considered as follows:
(17)
{a^=a0+Δab^=b0+Δbγ^=γ0+Δγ.
Furthermore, by substituting Eq. (17) into Eq. (10), the transformed line feature of Lh can be formulated as:
(18)
θ^h,1=θ˜h,1+γ^,
(19)
ρ˜h,12+a^2+b^2+2ρ˜h,1(b^sin θ^h,1+a^cos θ^h,1),
where θ̂h,1 represent the angle of the h-th line in I1 after transformation and ρ̂h,1 denotes the distance from the origin to the h-th line. Consequently, the new position vector h,1 of h-th line in I1 can be obtained.
The cost function is crucial for an optimization algorithm that guides optimization processes. In this study, the sum of the Euclidean distance between the position vectors of the lines was utilized as the cost function to measure the degree of image alignment. Therefore, assuming there are Hm pairwise line features, the cost function can be expressed as follows:
(20)
f(γ^,a^,b^)=hHm|r^h,1-rh,2|.
Notably, a minimum value of the cost function indicates that the two concerned images are well aligned. To improve efficiency, this study used SO to calculate the optimal solution for γ, a;, and b.

V. Experiments

To validate the superiority of the proposed method, different experiments were performed in three parts. The first part is concerned with proving the effectiveness of the proposed ISAR image registration method for simulated ISAR images, while the second part presents comparisons of the accuracy of different feature detection, optimization, and registration methods for ISAR applications using real measured images. In the last part, the robustness of the proposed method is analyzed through error analysis.

1. Effectiveness Validation

To validate the effectiveness of the proposed method, a number of experiments were carried out on simulated ISAR images, with the space target being RADARSAT-2, whose three-dimensional model is available in [25], as depicted in Fig. 5. The radar was set at Beijing (39.9 N, 116.4 E, 0 m), and the satellite two-line orbital element parameters were based on a set of public data available in the public satellite database [26]. The simulated images were generated using the range-Doppler algorithm. The main parameters of the ISAR imaging radar are listed in Table 1.
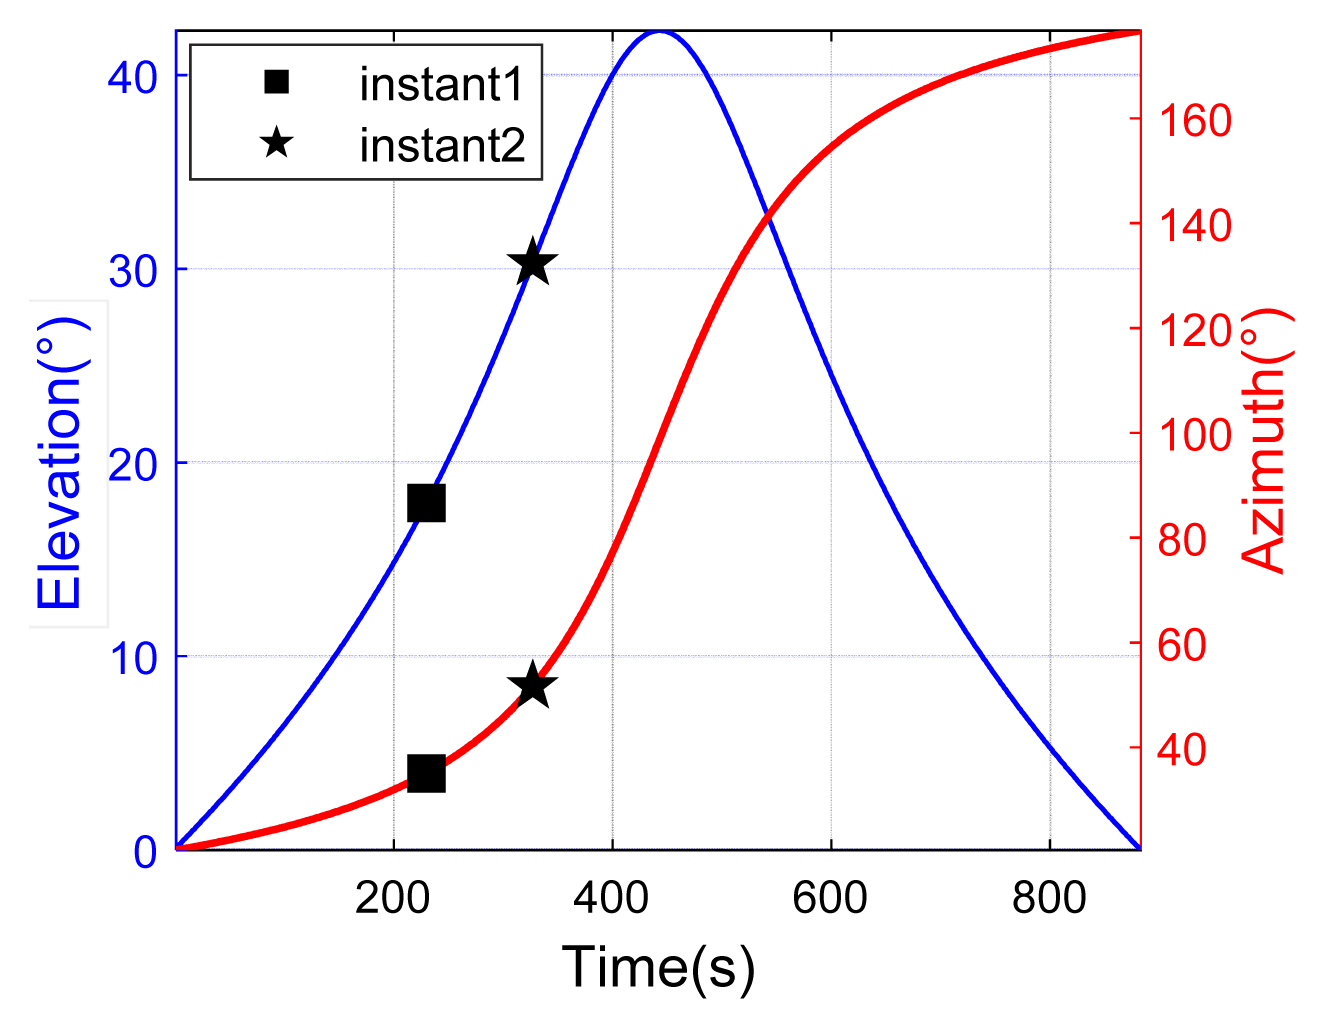
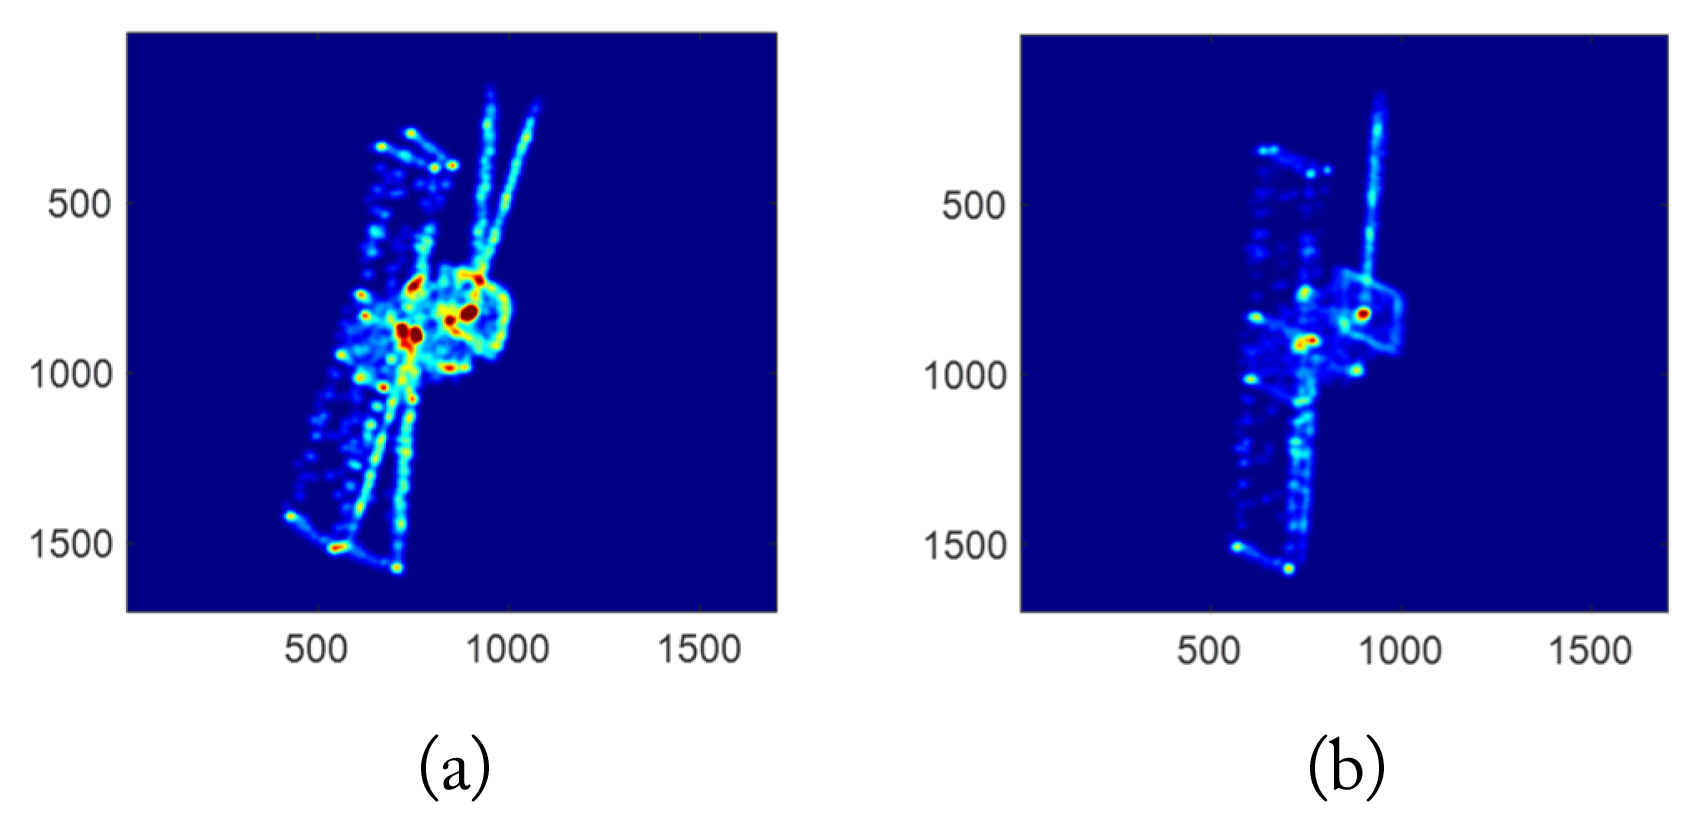
Two specific imaging times were selected from the observation views, as shown in Fig. 6. The ISAR images corresponding to the two views are presented in Fig. 7. In this context, it should be emphasized that the rectangular solar panels in both images are projected as lines, displaying limited information. Additionally, the reference image depicts an occurrence in which a solar panel obstructs the SAR antenna.
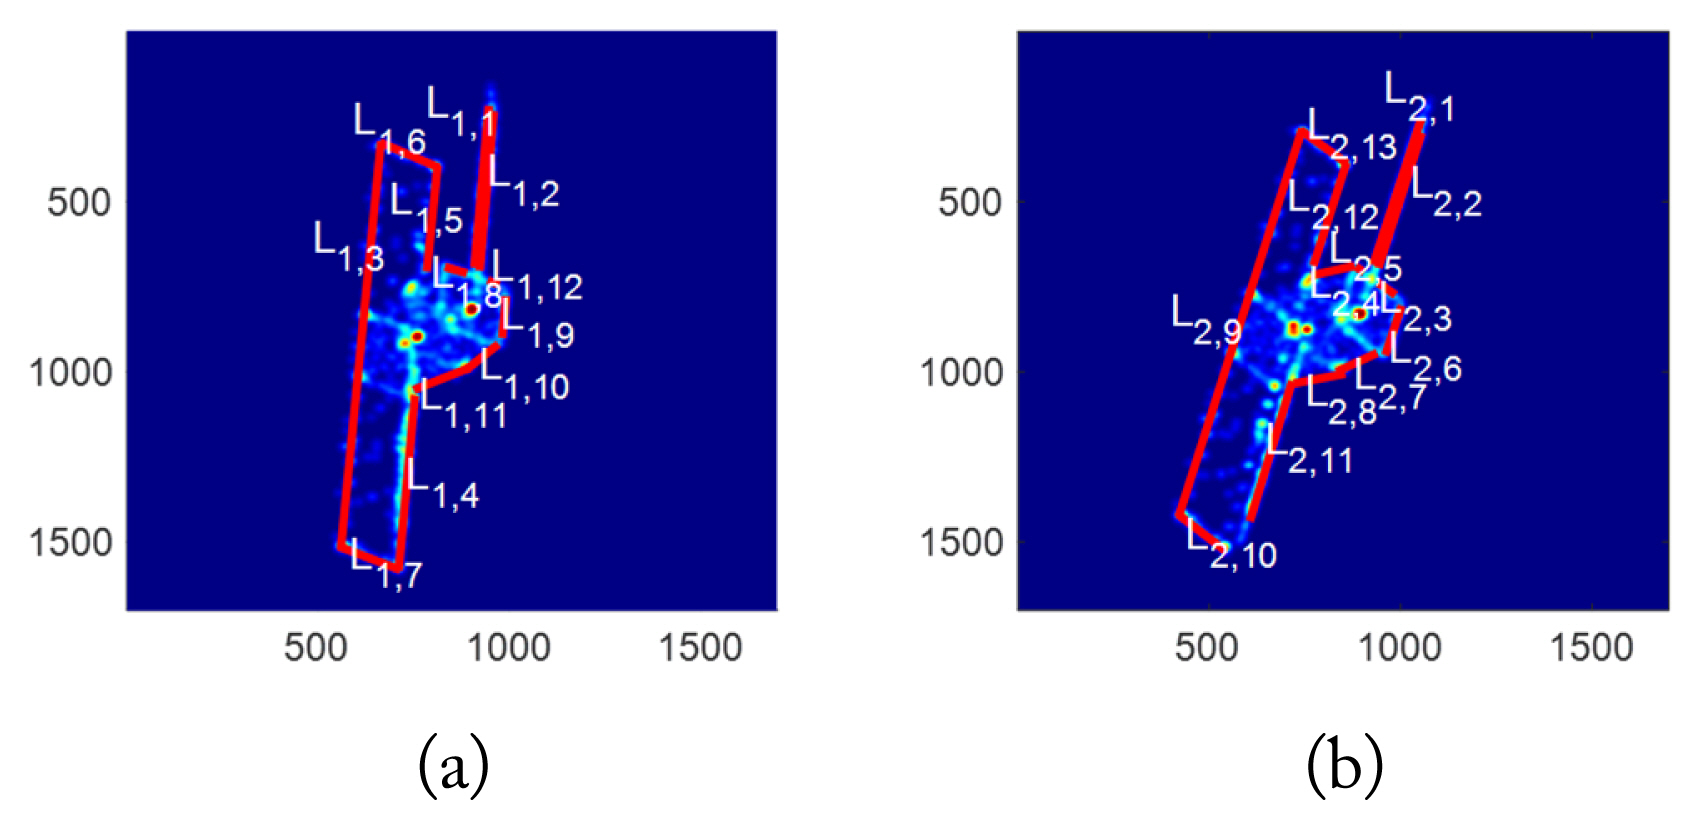
The line results detected by the proposed extraction method are depicted in Fig. 8, while the specific parameters of each line are listed in Table 2.
After feature matching, 12 association pairs were obtained—L1,1L2,1, L1,2L2,2, L1,3L2,9, L1,4L2,11, L1,5L2,12, L1,6L2,13, L1,7L2,10, L1,8L2,5, L1,9L2,6, L1,10L2,7, L1,11L2,8, and L1,12L2,3. Despite some obvious occlusions, the line features could be correctly matched. Most importantly, feature matching yielded the following rough register parameters: a0 = 0.6438, b0 = 0.3985, and γ0 = −11.5629°.
In subsequent optimization algorithms, the search range of Δa and of Δb were set to [−100,100], while of Δγ was set to [−3,3]. Table 3 lists the estimated register parameters, while Fig. 9 depicts the registration results obtained by overlaying the two images—the one before and the one after registration. It is observed that although the main body and the solar panel are well aligned, the SAR antenna presents an alignment error caused by a projection difference between the two imaging planes.

2. Comparison Experiments

Comparison experiments were conducted using real measured ISAR images obtained from the laboratory's official website [27] (@ Fraunhofer FHR). The experiments were carried out in a Windows 10 Professional environment using Intel Core i7-1165G7 processors with 2.80 GHz speed and 16.0 GB RAM, while the codes were implemented in MATLAB R2021a.

2.1 Comparison of line feature extraction methods

The line detection results had a significant effect on the accuracy of the image registration. In particular, the results of three different line detection methods were compared based on the outer contour of the real measured ISAR images shown in Fig. 10(a). The line features extracted by conducting HT and LSM are presented in Fig. 10(c) and 10(b), respectively, in which the parameters of the distance merge while the shortest length limit of a line is the same. Notably, the HT results show more than two lines near certain areas. In both results, the lines do not fit the actual edges of the target, indicating failed ISAR image registration. In contrast, the result obtained using the proposed line detection method, presented in Fig. 10(d), shows that the line features align well with the target boundary, highlighting that it is more suitable and effective than both HT and LSM.

2.2 Comparison of optimization algorithms

An experiment was conducted to compare the efficiency of particle swarm optimization (PSO) [28] and SO under the same configuration. The iterate time was set to 200, and the parameters related to the learning rate in the SO and PSO were reduced to 0.6 times.
Fig. 11(a) shows the cost function value for each iteration. It can be observed that the PSO quickly converges to reach a local optimum. Additionally, the variation curves of the absolute register errors in terms of the number of iterations during the iterative process are shown in Fig. 11(b), 11(c), and 11(d). It is evident that the parameter estimation accuracy of the SO is better than that of the PSO. Furthermore, the time consumption of PSO and SO was 0.0488 seconds and 0.0324 seconds, respectively.

2.3 Comparison of different registration methods

To verify the superiority of the proposed method, real measured ISAR images featuring the same target were first obtained. Subsequently, the results of the proposed method were compared with those obtained using SIFT and artificial bee colony by carrying out normalized cross correlation (ABC-NCC) [29], with mutual information (MI) [30], normalized image correlation (NIC), and algorithm runtime as the performance indicators. The results are listed in Table 4, while the two overlapped images generated by the experiment are depicted in Fig. 12. It is evident that the proposed method is both fast and accurate. Fig. 12(d) shows that the main body in the image obtained using the proposed method almost overlaps with the real measured one, although the tail is displaced due to secondary reflections.
Moreover, a different space object was also employed for image registration. The estimated register parameters are listed in Table 5, and the two overlapped images are presented in Fig. 13. It can be observed that the image produced by the proposed registration process successfully aligns with the target solar panel and accurately captures the change in the position of the SAR antenna.

3. Robustness Analysis

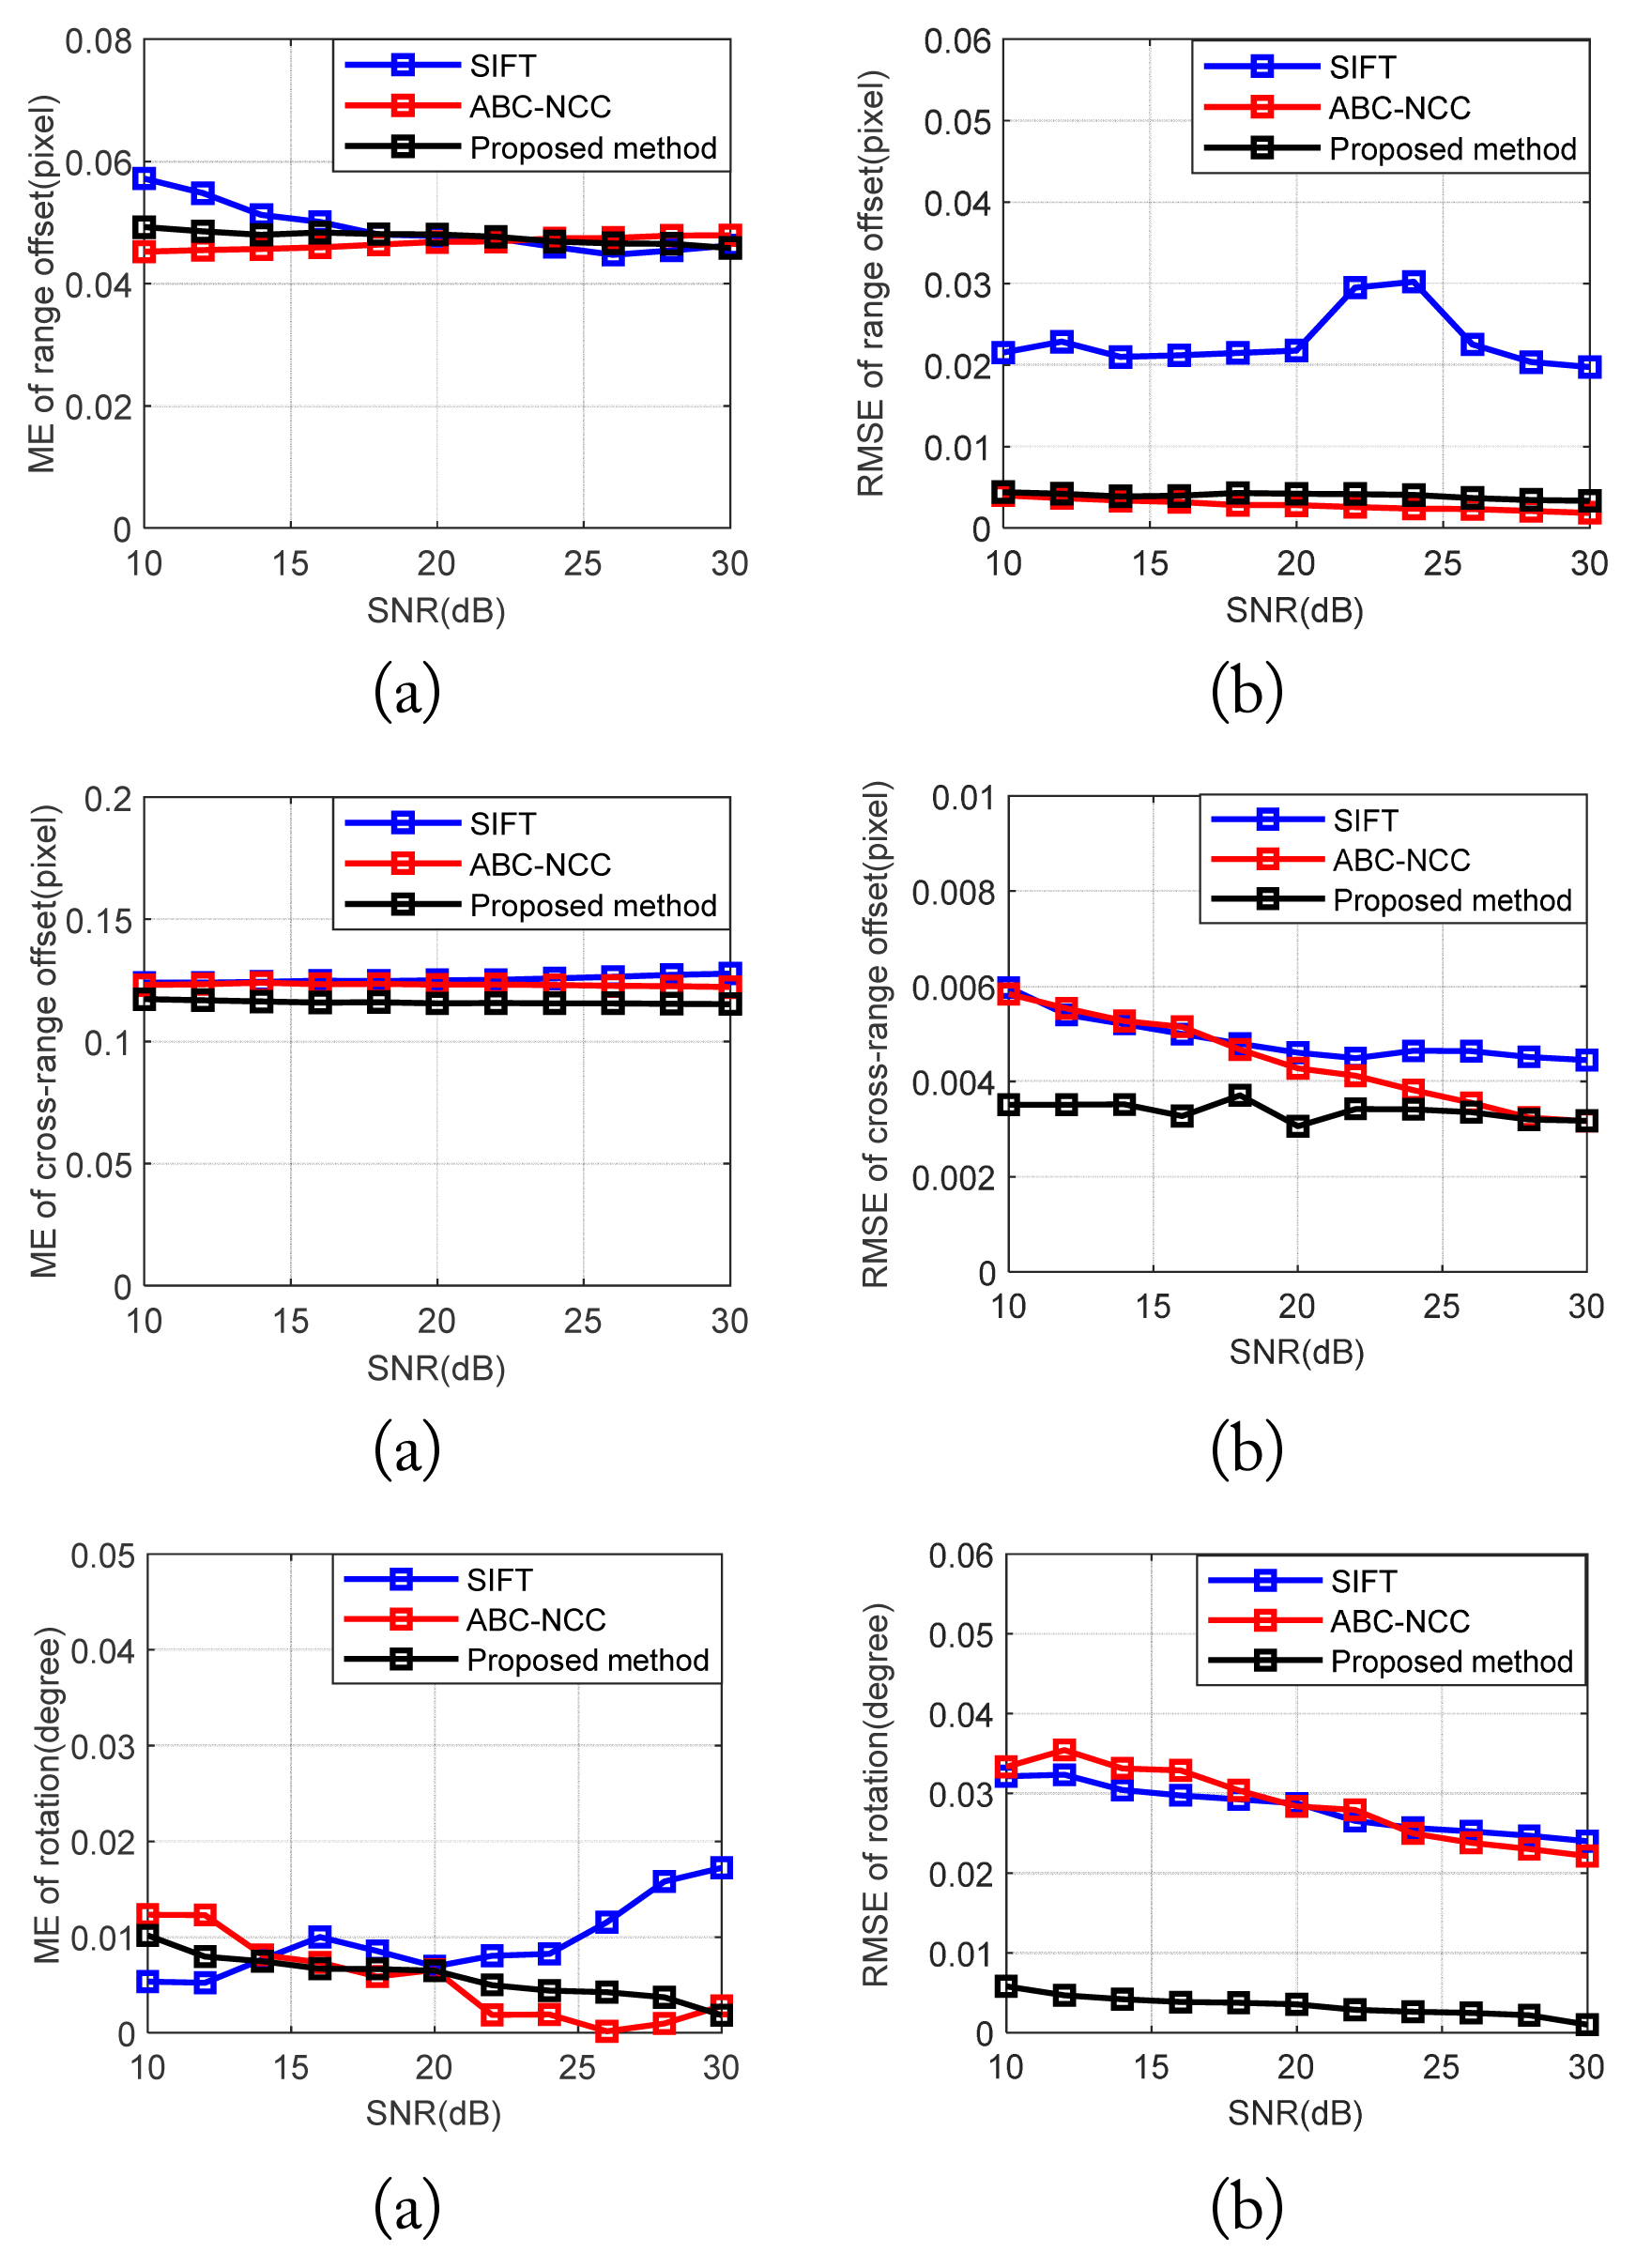
To further analyze the robustness of the proposed method, 1,000 Monte Carlo simulations were conducted using different SNRs. Under the same scatterer model and mapping parameters, the SNR range was set as 10–30 dB, while the step size was considered 2 dB. Fig. 14(a), 14(c), and 14(e) present the mean error (ME) of the range offset, cross-range offset, and rotation of the images at different SNRs, respectively. Furthermore, Fig. 14(b), 14(d), and 14(f) present the root mean square error (RMSE) of the range offset, cross-range offset, and rotation, respectively. The results show that the proposed method is more robust than SIFT and ABC-NCC, especially with regard to the rotation angle estimation, which reached the order of 0.001. In fact, the main reason for the large errors observed in SIFT or ABC-NCC was that they were based on point or area features, while the ISAR images were noisy and sparse.

VI. Conclusion

In this paper, a line features-based ISAR image registry method is proposed. First, a transformation model that incorporated both translational and rotational components was built, after which the traditional LSM was initially applied to detect the rough line features of the target contour. Subsequently, scatterers located in close proximity to the rough line features were fitted to refine and adjust the line features. The pairwise correspondence between the lines was examined using their spatial relations. Finally, considering the sum of the Euclidean distances between the lines as the cost function, the SO algorithm was employed to obtain precise parameters for ISAR image registration. The experimental results confirmed the effectiveness of the proposed algorithm in the ISAR image registration of different targets. Compared to existing methods, the proposed line features exhibited stronger robustness against noise and changes in image, as well as higher uniqueness and stability in matching, thereby improving the accuracy of the registration algorithms.

Acknowledgments

This work was supported by the National Natural Science Foundation of China (Grant No. 62071041, 61701554, and 52374169), Minzu University of China Foundation (No. 2023QNTS57).

Fig. 1
ISAR imaging geometry.
jees-2024-3-r-222f1.jpg
Fig. 2
An ideal turntable model.
jees-2024-3-r-222f2.jpg
Fig. 3
LSM results.
jees-2024-3-r-222f3.jpg
Fig. 4
Flowchart for feature matching.
jees-2024-3-r-222f4.jpg
Fig. 5
Three-dimensional model of RADARSAT-2.
jees-2024-3-r-222f5.jpg
Fig. 6
The corresponding LOS parameters.
jees-2024-3-r-222f6.jpg
Fig. 7
Simulated ISAR images of RADARSAT-2: (a) reference image and (b) sensed image.
jees-2024-3-r-222f7.jpg
Fig. 8
Feature extraction results from the contours: (a) reference image and (b) sensed image.
jees-2024-3-r-222f8.jpg
Fig. 9
Comparison of overlapped simulated images before and after registration: (a) initial and (b) register.
jees-2024-3-r-222f9.jpg
Fig. 10
Comparison of different line extraction methods: (a) outer contour, (b) HT, (c) LSM, and (d) the proposed method.
jees-2024-3-r-222f10.jpg
Fig. 11
Comparison of the optimization algorithm results: (a) cost function, (b) angle errors, (c) range errors, and (d) cross-range errors.
jees-2024-3-r-222f11.jpg
Fig. 12
Comparison of different methods for registering real measured images of the spacecraft: (a) initial, (b) SIFT, (c) ABC-NCC, and (d) the proposed method.
jees-2024-3-r-222f12.jpg
Fig. 13
Comparison of different methods for registering real measured images of ENVISAT: (a) initial, (b) SIFT, (c) ABC-NCC, and (d) the proposed method.
jees-2024-3-r-222f13.jpg
Fig. 14
Estimation errors of the simulation parameters at different SNRs: (a) ME of range offset, (b) RSME of range offset, (c) ME of cross-range offset, (d) RSME of cross-range offset, (e) ME of rotation angle, and (f) RSME of rotation angle.
jees-2024-3-r-222f14.jpg
Table 1
Optimized dimensions of the 1 × 4 array
Parameter Value
Bandwidth 1.25 GHz
Center frequency 10 GHz
Range resolution 0.12 m
Cross-range resolution 0.12 m
Pulse repetition frequency 100 Hz
Table 2
Details of the extracted lines
h Reference image Registration image


θ̂h,1 (°) ρ̂h,1 (pixel) θ̂h,2 (°) ρ̂h,2 (pixel)
1 −86.4261 916.0495 −73.6682 1,057.3776
2 −86.4796 930.1488 −74.1118 1,058.9111
3 −86.9952 576.8552 37.2110 920.3972
4 −86.2272 728.5355 −13.2725 925.9346
5 −85.8718 792.2517 35.4692 862.7557
6 24.8210 647.9276 −73.5892 1,013.8455
7 22.2410 486.4924 −26.6260 972.5338
8 18.1381 791.7010 −11.1237 935.7176
9 −86.3520 991.4765 −74.1940 730.6426
10 −41.8396 908.5218 40.8972 864.1083
11 −25.0343 792.1271 −74.9215 862.7557
12 24.0169 913.0905 −74.0297 1,013.8455
13 −38.8298 730.3151
Table 3
Registration results of the simulated images
Parameter True value Estimated value Error
a (pixel) 10 10.1273 0.1273
b (pixel) 10 10.2250 0.2250
γ (°) −12 −11.9074 −0.0926
Table 4
Comparison of the proposed method with the different registration methods applied to real measured images of the spacecraft
Method SIFT ABC-NCC Proposed method
a (pixel) 121.0021 4.2485 4.0324
b (pixel) 119.9711 2.9892 3.7270
γ (°) −13.6137 −15.1116 −15.0958
MI 0.0399 0.3364 0.3370
NIC 0.0916 0.7481 0.7449
Time (s) 15.4480 45.9330 10.3697
Table 5
Comparison with the different registration methods applied to real measured images of ENVISAT
Method SIFT ABC-NCC Proposed method
a (pixel) −114.0813 −61.2005 −53.8905
b (pixel) 420.1666 35.9135 79.0147
γ (°) −16.6820 −12.4281 −16.9270
MI 0.0376 0.2970 0.2748
NIC 0.0040 0.6446 0.4810
Time (s) 59.7761 69.0775 18.1011

References

1. A. Orlova, R. Nogueira, and P. Chimenti, "The present and future of the space sector: a business ecosystem approach," Space Policy, vol. 52, article no. 101374, 2020. https://doi.org/10.1016/j.spacepol.2020.101374
crossref
2. M. Arar, Y. Ginger, D. Danon, A. H. Bermano, and D. Cohen-Or, "Unsupervised multi-modal image registration via geometry preserving image-to-image translation," In: Proceedings of the IEEE/CVF Conference on Computer Vision and Pattern Recognition; Seattle, WA, USA. 2020, pp 13407–13416.
crossref
3. Q. Yu, D. Ni, Y. Jiang, Y. Yan, J. An, and T. Sun, "Universal SAR and optical image registration via a novel SIFT framework based on nonlinear diffusion and a polar spatial-frequency descriptor," ISPRS Journal of Photogrammetry and Remote Sensing, vol. 171, pp. 1–17, 2021. https://doi.org/10.1016/j.isprsjprs.2020.10.019
crossref
4. T. Zhang, R. Zhao, and Z. Chen, "Application of migration image registration algorithm based on improved SURF in remote sensing image mosaic," IEEE Access, vol. 8, pp. 163637–163645, 2020. https://doi.org/10.1109/ACCESS.2020.3020808
crossref
5. H. Zhang, W. Ni, W. Yan, D. Xiang, J. Wu, X. Yang, and H. Bian, "Registration of multimodal remote sensing image based on deep fully convolutional neural network," IEEE Journal of Selected Topics in Applied Earth Observations and Remote Sensing, vol. 12, no. 8, pp. 3028–3042, 2019. https://doi.org/10.1109/JSTARS.2019.2916560
crossref
6. B. S. Kang, K. Lee, and K. T. Kim, "Image registration for 3-D interferometric-ISAR imaging through joint-channel phase difference functions," IEEE Transactions on Aerospace and Electronic Systems, vol. 57, no. 1, pp. 22–38, 2021. https://doi.org/10.1109/TAES.2020.3021108
crossref
7. W. Tang, F. Jia, and X. Wang, "Image Large rotation and scale estimation using the Gabor filter," Electronics, vol. 11, no. 21, article no. 3471, 2022. https://doi.org/10.3390/electronics11213471
crossref
8. Q. Gao, X. Wei, Z. N. Wang, and D. T. Na, "An imaging processing method for linear array ISAR based on image entropy," Applied Mechanics and Materials, vol. 128–129, pp. 525–529, 2012. https://doi.org/10.4028/www.scientific.net/AMM.128-129.525
crossref
9. E. Adel, M. Elmogy, and H. Elbakry, "Image stitching based on feature extraction techniques: a survey," International Journal of Computer Applications, vol. 99, no. 6, pp. 1–8, 2014.
crossref
10. F. Bellavia and C. Colombo, "Is there anything new to say about SIFT matching? International Journal of Computer Vision, vol. 128, pp. 1847–1866, 2020. https://doi.org/10.1007/s11263-020-01297-z
crossref
11. Y. D. Pranata, K. C. Wang, J. C. Wang, I. Idram, J. Y. Lai, J. W. Liu, and I. H. Hsieh, "Deep learning and SURF for automated classification and detection of calcaneus fractures in CT images," Computer Methods and Programs in Biomedicine, vol. 171, pp. 27–37, 2019. https://doi.org/10.1016/j.cmpb.2019.02.006
crossref pmid
12. Y. Zou, J. Tian, G. Jin, and Y. Zhang, "MTRC-tolerated multi-target imaging based on 3D Hough transform and non-equal sampling sparse solution," Remote Sensing, vol. 13, no. 19, article no. 3817, 2021. https://doi.org/10.3390/rs13193817
crossref
13. E. J. Almazan, R. Tal, Y. Qian, and J. H. Elder, "MCMLSD: a dynamic programming approach to line segment detection," In: Proceedings of the IEEE Conference on Computer Vision and Pattern Recognition; Honolulu, HI, USA. 2017, pp 2031–2039. https://doi.org/10.1109/CVPR.2017.620
crossref
14. J. Tian, S. Liu, X. Zhong, and J. Zeng, "LSD-based adaptive lane detection and tracking for ADAS in structured road environment," Soft Computing, vol. 25, pp. 5709–5722, 2021. https://doi.org/10.1007/s00500-020-05566-4
crossref
15. M. Chen, S. Yan, R. Qin, X. Zhao, T. Fang, Q. Zhu, and X. Ge, "Hierarchical line segment matching for wide-baseline images via exploiting viewpoint robust local structure and geometric constraints," ISPRS Journal of Photogrammetry and Remote Sensing, vol. 181, pp. 48–66, 2021. https://doi.org/10.1016/j.isprsjprs.2021.09.002
crossref
16. F. A. Hashim and A. G. Hussien, "Snake optimizer: a novel meta-heuristic optimization algorithm," Knowledge-Based Systems, vol. 242, article no. 108320, 2022. https://doi.org/10.1016/j.knosys.2022.108320
crossref
17. Y. Wang, Y. Shu, X. Yang, M. Zhou, and Z. Tian, "Recent progress of ISAR imaging algorithms," Communications, Signal Processing, and Systems. Singapore: Springer, 2020. p.1418–1421. https://doi.org/10.1007/978-981-15-8411-4_188
crossref
18. L. Yang, M. Xing, L. Zhang, G. C. Sun, Y. Gao, Z. Zhang, and Z. Bao, "Integration of rotation estimation and high-order compensation for ultrahigh-resolution microwave photonic ISAR imagery," IEEE Transactions on Geoscience and Remote Sensing, vol. 59, no. 3, pp. 2095–2115, 2021. https://doi.org/10.1109/TGRS.2020.2994337
crossref
19. P. Zhou, G. Zhang, and W. Yang, "A review of ISAR imaging technology," In: Proceedings of 2020 IEEE International Conference on Information Technology, Big Data and Artificial Intelligence (ICIBA); Chongqing, China. 2020, pp 664–668. https://doi.org/10.1109/ICIBA50161.2020.9277180
crossref
20. R. Soundrapandiyan, S. C. Satapathy, P. V. S. S. R. Chandra Mouli, and N. G. Nhu, "A comprehensive survey on image enhancement techniques with special emphasis on infrared images," Multimedia Tools and Applications, vol. 81, pp. 9045–9077, 2022. https://doi.org/10.1007/s11042-021-11250-y
crossref
21. F. Samadi, G. Akbarizadeh, and H. Kaabi, "Change detection in SAR images using deep belief network: a new training approach based on morphological images," IET Image Processing, vol. 13, no. 12, pp. 2255–2264, 2019. https://doi.org/10.1049/iet-ipr.2018.6248
crossref
22. J. Liang, C. Fan, S. Hou, C. Shen, Y. Huang, and S. Yu, "GaitEdge: beyond plain end-to-end gait recognition for better practicality," Computer Vision – ECCV 2022. Cham, Switzerland: Springer, 2022. p.375–390. https://doi.org/10.1007/978-3-031-20065-6_22
crossref
23. D. Dhillon and R. Chouhan, "Enhanced edge detection using SR-guided threshold maneuvering and window mapping: handling broken edges and noisy structures in canny edges," IEEE Access, vol. 10, pp. 11191–11205, 2022. https://doi.org/10.1109/ACCESS.2022.3145428
crossref
24. X. Zhang, J. Cui, J. Wang, C. Sun, Z. Zhu, F. Wang, and Y. Ma, "Parametric scatterer extraction method for space-target inverse synthetic aperture radar image CLEAN," IET Radar, Sonar & Navigation, vol. 17, no. 5, pp. 899–915, 2023. https://doi.org/10.1049/rsn2.12386
crossref
25. National Aeronautics and Space Administration, NASA 3D Resources, c2023. [Online]. Available: https://nasa3d.arc.nasa.gov

26. The public satellite database, c2024. [Online]. Available: https://www.n2yo.com

28. A. Pradhan, S. K. Bisoy, and A. Das, "A survey on PSO based meta-heuristic scheduling mechanism in cloud computing environment," Journal of King Saud University-Computer and Information Sciences, vol. 34, no. 8, pp. 4888–4901, 2022. https://doi.org/10.1016/j.jksuci.2021.01.003
crossref
29. A. Banharnsakun, "Feature point matching based on ABC-NCC algorithm," Evolving Systems, vol. 9, pp. 71–80, 2018. https://doi.org/10.1007/s12530-017-9183-y
crossref
30. Z. Peng, W. Huang, M. Luo, Q. Zheng, Y. Rong, T. Xu, and J. Huang, "Graph representation learning via graphical mutual information maximization," In: Proceedings of The Web Conference 2020; Taipei, Taiwan. 2020, pp 259–270. https://doi.org/10.1145/3366423.3380112
crossref

Biography

jees-2024-3-r-222f15.jpg
Linhua Wu, https://orcid.org/0009-0006-0790-0556 was born in 1999. She received her B.E. degree from Hubei University of Economics, Wuhan, China, in 2021. Currently, she is an M.E. candidate at the School of Information Engineering, Minzu University of China. Her current research interests include ISAR image processing and computer architecture.

Biography

jees-2024-3-r-222f16.jpg
Lizhi Zhao, https://orcid.org/0000-0001-7216-9014 was born in 1986. She received her B.E. degree from Hebei University of Technology in 2008 and her Ph.D. degree from Beijing Institute of Technology in 2015. She was a joint training student at the University of Pisa in 2013. Currently, she is a lecture at Minzu University of China, Beijing, China. Her research interests include radar imaging and bistatic radar signal processing.

Biography

jees-2024-3-r-222f17.jpg
Junling Wang, https://orcid.org/0000-0001-7158-0688 received his B.E. and M.E. degrees from China University of Petroleum, Qingdao, China, in 2005 and 2008, respectively. In 2013, he received his Ph.D. degree from the Beijing Institute of Technology (BIT). He was an exchange student in the Department of Signal Theory and Communications, Universitat Politecnica de Catalunya, in 2010. Since 2013, he has been working in the School of Information and Electronics, BIT, Beijing, China, where he is currently an associate professor. His current research interests include satellite detection and imaging as well as radar signal processing.

Biography

jees-2024-3-r-222f18.jpg
Jiaoyang Su, https://orcid.org/0009-0008-7626-0577 was born in 1988. He received his B.E. degree from Minzu University of China in 2011 and his M.E. degree from Beijing Institute of Technology in 2013. Currently, he is an engineer at Minzu University of China, Beijing, China. His research interests include computer architecture and signal processing.

Biography

jees-2024-3-r-222f19.jpg
Weijun Cheng, https://orcid.org/0000-0003-1432-4324 received his M.S. degree in electronics and control engineering from the China University of Mining and Technology, Beijing, China, in 1998, and his Ph.D. degree in telecommunications engineering from Beijing University of Posts and Telecommunications, Beijing, China, in 2004. He was a postdoctoral research fellow in electronics engineering from 2005 to 2007 at Peking University, Beijing, China. From 2017 to 2018, he was a visiting scholar at the School of Electrical, Computer, and Energy Engineering in Arizona State University, AZ, USA, along with Professor Junshan Zhang. Currently, he is an associate professor at the School of Information Engineering, Minzu University of China, Beijing, China. His research interests are wireless communication theory and AI in IoT.
TOOLS
Share :
Facebook Twitter Linked In Google+
METRICS Graph View
  • 0 Crossref
  • 0 Scopus
  • 1,579 View
  • 38,370,253 Download
Related articles in JEES

ABOUT
ARTICLE CATEGORY

Browse all articles >

BROWSE ARTICLES
AUTHOR INFORMATION
Editorial Office
#706 Totoo Valley, 217 Saechang-ro, Yongsan-gu, Seoul 04376, Korea
Tel: +82-2-337-9666    Fax: +82-2-6390-7550    E-mail: admin-jees@kiees.or.kr                

Copyright © 2024 by The Korean Institute of Electromagnetic Engineering and Science.

Developed in M2PI

Close layer
prev next